2 results
12th grade measurement graphic organizers for Microsoft PowerPoint

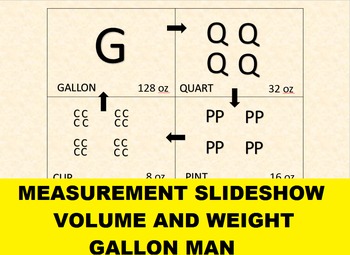
Measurement Slideshow Lesson for use with Gallon Man Art Project and Quiz
The Gallon Man is a great way for students to remember equivalent measurements, but creating and adding this introductory chart to my measurement lessons was one of the best things I've done for my classes.
I usually draw it from scratch on the board each time I teach measurement, but this slideshow goes through each step for you with just a click of the mouse! There are only 3 slides, but there are 17 animated steps. It usually takes about 45 minutes to get through creating the chart and verb
Grades:
6th - 12th

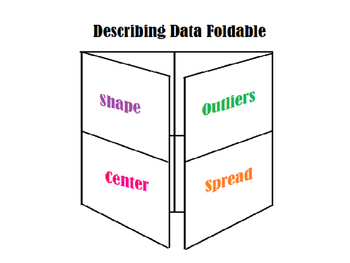
Analyzing Data Foldable
This is a foldable designed to review how to analyze data. It includes finding the mean, median, IQR, and possible outliers. Some of the foldable describes calculator steps with the TI-83 or TI-84. It can be edited in case you do not want to include calculator directions.There is additional information on the back of the foldable about normal distribution problems and calculator steps. This can be eliminated all together..
Subjects:
Grades:
8th - 12th
Also included in: Data Analysis Foldable Bundle
Showing 1-2 of 2 results


