1,484 results
5th grade Winter graphing resources for Microsoft Word
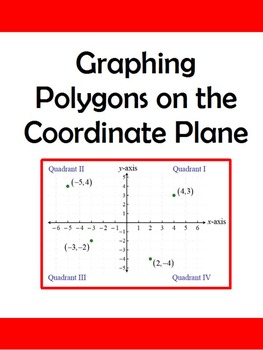
Graphing Polygons on the Coordinate Plane to Find Area/Perimeter
This activity asks the students to plot various ordered pairs on a coordinate plane and connect the points to make a polygon. Then they are expected to calculate the area and/or perimeter of each shape. The first worksheet has a square, two rectangles and a triangle. The triangle is starred to show higher level thinking. Each polygon is to be colored a different color. The second worksheet asks the students to plot the points of five polygons: a triangle, two rectangles and two composite f
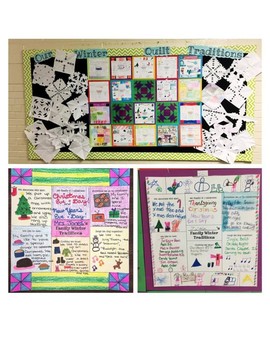
December Family Project - *EDITABLE* Winter Traditions Quilt *EDITABLE*
Our class winter traditions quilt! Not all families celebrate a holiday this season, so you can use this family project to include everyone! A tradition could include celebrating the first snow fall, making a snowman, or even just drinking hot cocoa together!
Subjects:
Grades:
PreK - 6th
Types:
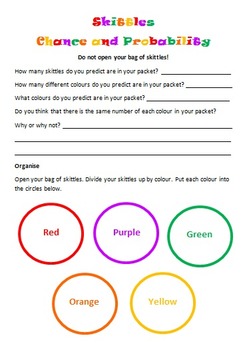
Skittles Chance and Probability (Editable)
Chance and Probability activity using yummy Skittles!!!
Students are to predict the colours and quantities before they open the skittles bag. Students are to complete a chance experiment where they use a tally to collect their data. Students then transfer their data in fractions, decimals and percentages. Students are to create a bar graph using their data as well as answer chance and probability questions about the data. I used this with my grade 5/6 students and they loved it!
Subjects:
Grades:
3rd - 10th
Types:
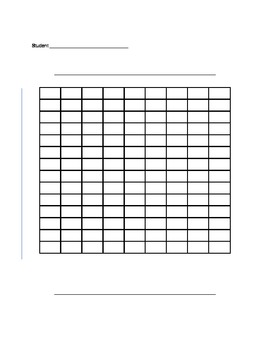
Blank Bar Graph/Double Bar Graph Template
This is a bar graph template that can be used by teachers to teach students how to understand bar graphs and create their own bar graphs. Teachers can use this template teach students about parts of a bar graph and how to interpret data in bar graphs.
Grades:
1st - 12th
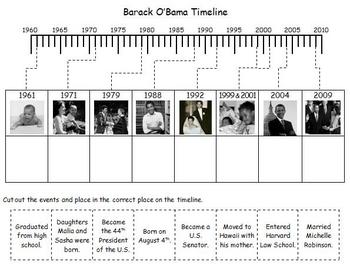
President's Day - Barack Obama Photo Timeline
Students will learn about the important events in Barack Obama's life as they complete this photo timeline. Two versions are included, one for upper elementary and one for lower elementary.
Subjects:
Grades:
1st - 6th
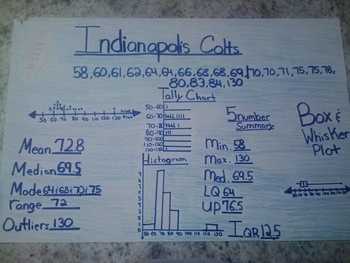
Favorite Sports Team: Data Displays and Measures of Central Tendency Project
Students will create a poster using sports statistics. Depending on the time of year, you may want to use football scores, basketball scores, data from the Olympics, etc. Students will use the internet (or you can print out statistics for them) to find sports data.
The students really buy into this project because it is about something they are interested in - their favorite sports team!
Students will display their knowledge of several data displays: line plot, tally chart, histogram and bo
Subjects:
Grades:
5th - 8th
Types:

Merry and Bright Christmas Holiday Door Bulletin Decor/Decorations PDF
Hello! Welcome to Julie's Color Wheelby ♥Julie Marie>>>DESCRIPTION<<<This bright, fun and colorful bulletin board or door decor is the perfect way to celebrate Christmas and winter holidays! It includes the wording for "Merry and Bright", a matching bulletin/door border, snowflake clipart and light bulb clipart, and 8 colorful hand draw trees (that come in two sizes). Printable on 8.5x11 paper, just print, cut, and hang. I recommend to use a color printer, to print on card stoc
Grades:
PreK - 12th
Also included in: Christmas Holiday Editable Invitation and Decor/Decorations
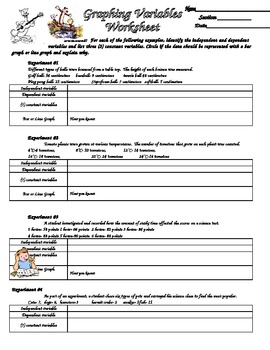
Scientific Method Variables and Graphing Practice
Students are given six different sets of experimental data and asked to identify the variables (independent, dependent etc.). They also reinforce graphing by identifying if the data should be represented with a bar or line graph. With this information, students the create data tables and graphs for the data.
Subjects:
Grades:
3rd - 12th
Types:
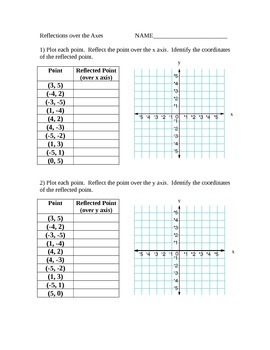
Reflecting Points and Shapes over the Axes
This worksheet gives students an opportunity to practice reflecting points and shapes over the x and y axis. Students explore that a reflection has on the impact on x and y values of a point. There are 20 problems on reflecting points and 4 problems on reflecting triangles.
Grades:
5th - 7th
Types:
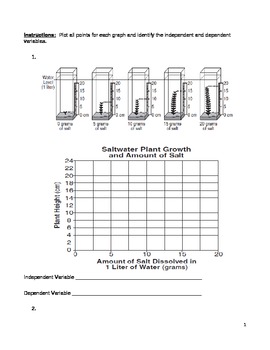
Middle School Math and Science Graphing Practice - Middle School Line Graphs
Use this resource to help your middle school math and science students learn and practice how to make line graphs as well as identify the independent and dependent variables. Move beyond bar graphs! There is a teacher key provided and eight graphs for practice.
line graph, plot points, x-axis, y-axis, independent variable, dependent variable
Subjects:
Grades:
5th - 9th
Types:
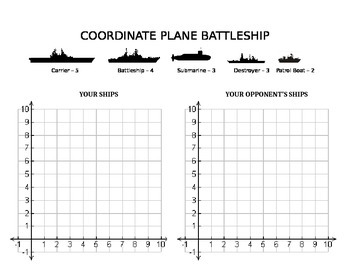
Coordinate Plane Battleship
Fun way to have your students practice reading and identifying points on a coordinate plane. Uses 1st quadrant only.
Print and laminate for repeated use! Have students place their ships on the left. Using 2 colors of dry erase markers, they make guesses on the right side, marking a miss with one color and a hit with another. On the left side, they mark the misses and hits from their opponents guesses.
CCSS.Math.Content.5.G.A.1
Making Science Charts and Graphs
A simplified look at making charts and organizing data in science.
-Data Charts
-Circle Graphs
-Bar Graphs
-Line Graphs
-Key Vocabulary List
-Quiz/Assessment
-Activity - Practice
-Teacher answer key for quiz and activity
Thanks for taking the time to stop by my store!
Mrs. Degs
Teaching Science Well
Blog: http://teachingsciencewell.wordpress.com/
Facebook: https://www.facebook.com/TeachingScienceWell
TPT: http://www.teacherspayteachers.com/Store/Teaching-Science-Well-Science-Resources
Pi
Subjects:
Grades:
3rd - 10th
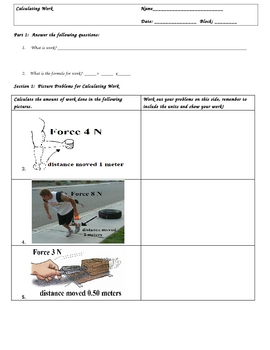
Calculating Work (W=Fxd) Worksheets and Key
Calculating Work (W=Fxd) Worksheets and KeyIf you have been teaching a Simple Machines or Energy Unit, then you need to check out this three page lesson to teach calculating work. It is in three sections.Section 1: Picture QuestionsSection 2: Word Problems/with Challenge QuestionsSection 3: Charting/Graphing ProblemsAll problems are worked out and the key is included.These worksheets include the renown Triangle Method, which has been a proven problem solver for students who struggle in math.The
Subjects:
Grades:
3rd - 12th, Higher Education, Adult Education
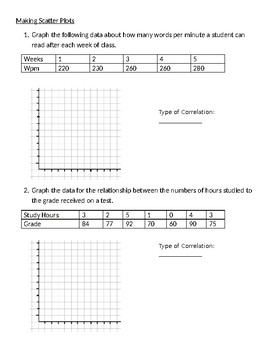
Making Scatter Plots Worksheet
2 pages of practice problems with given information to create scatter plots
Grades:
5th - 12th
Types:
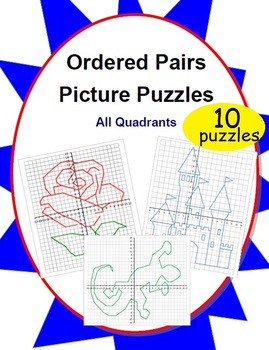
10 Ordered Pairs Mystery Picture Puzzles (All Quadrants)
10 original pictures perfect for any order pair puzzler. Start simple with a continuous connect-the-dot picture and graduate to more complex pictures composed of multiple sections. The built-in self-checking nature of creating a picture makes it easy for students to immediately assess their own progress.This 15-page PDF file includes:- 10 reproduction-ready original picture puzzles- An illustrated key so teachers can select appropriate puzzles based on student skill level and intended use- Numbe
Grades:
4th - 10th
Types:
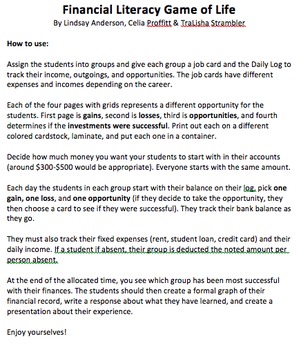
Financial Literacy Game of Life
Students put their financial literacy skills to use in this game of life. Each group is assigned a job with a salary, fixed and variable expenses, opportunities for investment, gains, and losses. Students track their bank balance throughout and on a daily log. It gives students a realistic insight into managing family resources and they enjoy the game and competition aspect of the activity.
(Note: I suggest you start them with a Day One starting balance of $200).
Subjects:
Grades:
3rd - 6th
Types:
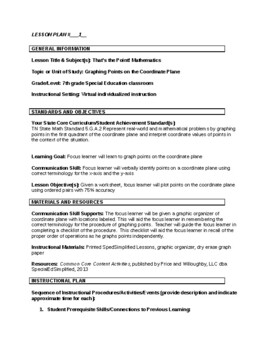
SPED edTpa Task 1 Part B Lesson Plans passed in 2021
Task 1 Part B of SPED edTpa which passed with a 54 in April 2021.Subject was Math for a 7th grader who performs at 5th grade level.This is for use as a study resource or model for edTpa completion. Copying any portion of this is against edTpa rules.
Grades:
5th - 7th
Types:
CCSS:
Paper Airplane 5th Grade Common Core 5.MD.2 Line Plot Performance Task
This task allows students to work in groups to construct a paper airplane, fly it, measure the distance flown, and then create a line plot based on their data. This comes with student friendly instructions, and guiding questions for students to complete following the completion of their line plot. This corresponds with the fifth grade Common Core Math standards for line plots. This could be adjusted to fit fourth grade line plot standards.
Subjects:
Grades:
4th - 5th
Types:
New Years - January Back to School Parent Letter *Editable!
Going back to school in January can be difficult. This letter will help you send out any announcements and set expectations for the coming month. This letter is completely editable and there is a really pretty New Year border around it.You can change this letter up and personalize it as you wish or keep it mostly the same! Good Luck for the new year! Enjoy! :)
Grades:
PreK - 12th
End of the Year Ice Cream Glyph
Students will follow directions to complete their ice cream glyph. When they are finished, have students display their glyph in a central location, such as on a bulletin board or in a hallway. Next, students will complete the "Reading the End of the Year Ice Cream Glyph" page. They will use the information from the whole class's glyphs to complete their pages. It's more fun if the students' names are on the back of their ice cream glyph, so students can guess whose is whose. Afterwards, they can
Subjects:
Grades:
2nd - 5th
Types:
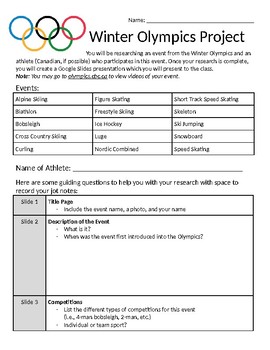
Winter Olympics Research Project
Independent research project on the Winter Olympics. Students choose an event and an athlete who participates in the event to research and then complete a Google Slides presentation. Includes project outline, guiding questions, graphic organizer, and rubric for assessment. Slight focus on Canada, but can modify to suit your needs.
100th Day of School Shirt Project
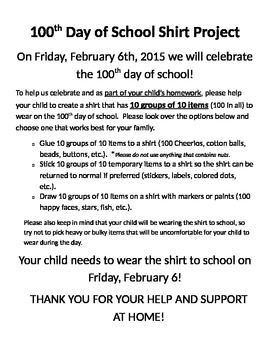
This letter is one that can be sent home to parents requesting students to make a shirt for the 100th day of school. There are two files included: one shirt is for older students that requests shirts made of 10 groups of 10 to help with place value. The other one simply asks for 100 items. This is a wonderful family project that students of any age love to do!
Subjects:
Grades:
PreK - 5th
Types:

FREE Valentine Party, Name Plate, and Class List Templates - WORD
These templates make planning your class Valentine's Day party a breeze! Just open and edit with YOUR information.
The party invitation/informational letter lets you explain YOUR when and where and even asks for parent help! Edit the super cute Valentine Class List to contain the names of YOUR kiddos. There are two choices of nameplates, perfect for very easy Valentine's Day mailboxes - all with very little planning for the teacher!
Enjoy the holiday!!
Feedback is always appreciated and ple
Subjects:
Grades:
K - 6th
Types:
Coordinate Graph Picture: Flowers
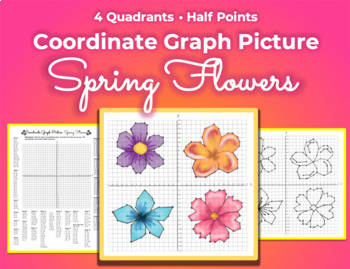
SPRING IS ALMOST HERE! Keep your kids nice and busy with these lovely spring flowers. There are a lot of half points, so it'll require some concentration. BONUS - this doubles as a coloring sheet when they're done. :D Note to teacher: Each flower is in its own quadrant. You can assign more or less depending on ability. Quadrant I = Shapes 1-8Quadrant II = Shapes 9-12Quadrant III = Shapes 13-16 (plus the lines) Quadrant IV = Shapes 17-23 search terms: coordinate graph graphing picture drawing spr
Grades:
4th - 8th
Types:
Showing 1-24 of 1,484 results


