52 results
Test preparation graphing webquests

Latin American Geography WebQuest
The WebQuest is a great way to introduce Latin America or review Latin American Geography. Students will visit various website to find the answers to geography based questions. They will then use their answers to unscramble the answer to a riddle. This aspect makes it fun for students. I often offer a reward for the student or group who completes the WebQuest and solves the riddles first. Don’t have many computers? This WebQuest could also be used as a station activity with as few as 6 computers
Subjects:
Grades:
4th - 10th
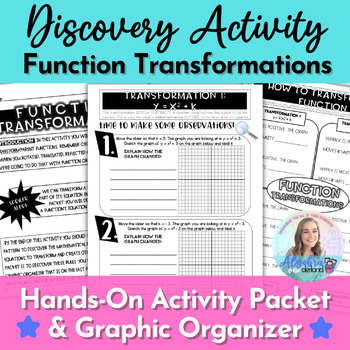
Algebra 1 Function Transformation Parent Functions Hands On Discovery Activity
Help students discovery the rules for function transformations with this hands-on activity! Students will graph function transformations and come to a conclusion about how changing the equation affects change in the graph.Included:Activity packet with: Four graphing tasks to discover the rules. One graphic organizer to generalize the rulesAnswer KeyFlexible for your needs: Students can use any graphing tool such as TI Calculators or the Desmos Online Calculator or TI Calculators.Included: easy-t
Subjects:
Grades:
8th - 12th
CCSS:
Also included in: Algebra 1 Function Transformations Unit Activities, Project and Test
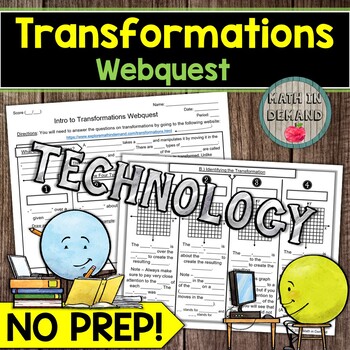
Transformations Webquest Reflection Rotation Translation Dilation
Students will need a device for my math webquest on transformations. Students will be given a link that goes to my website containing information about reflections, rotations, translations, and dilations. Students will learn how to: (1) identify a transformation, (2) perform a transformation, and (3) use the transformation rules to give the coordinates of an image. I have included a worksheet that aligns to the information on my website. All you need to do is print and go! In addition, there is
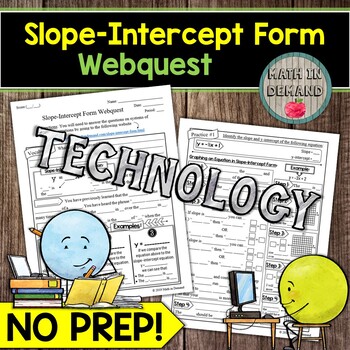
Slope-Intercept Form Webquest Math
Students will need a device for my math webquest on slope-intercept form. Students will be given a link that goes to my website containing information about slope-intercept form. Students will learn how to: (1) identify the slope and y-intercept of an equation given in slope-intercept form, (2) graph an equation in slope-intercept form, (3) write an equation in slope-intercept form given a linear graph, and (4) convert to slope-intercept form by solving for y. I have included a worksheet that a
Grades:
7th - 8th
Types:
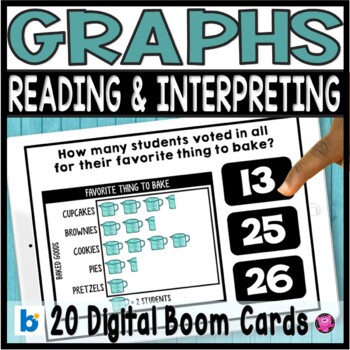
Reading Pictographs - Picture Graphs - Reading and Interpreting Data
These DIGITAL Picture Graphs are a super fun and interactive math activity for your 1st, 2nd, and 3rd grade students to practice reading, analyzing, and interpreting data! Students will answer use picture graphs, and bar graphs to answer questions like: most/least favorites, totals for each group, and compare, analyzing, and interpreting data. Boom Card can be used with Google Classroom, SeeSaw, ClassDoJo and other platforms. Click here to SAVE 20% on my Graphing Bundle!PLEASE NOTE YOU ARE PURCH
Subjects:
Grades:
1st - 3rd
Types:
Also included in: Kindergarten Math Worksheets Games and Centers YEAR-LONG BUNDLE
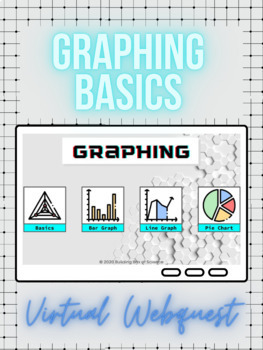
Graphing Basics Self-Guided Webquest
Introduce the Basics of Graphing with this Virtual Science WebQuest ideal for the beginning of the year! Students can answer the questions within their own copy of the presentation or they can complete the PDF Worksheet while viewing the Slides in Present Mode. This assignment is a great way to teach students how and when to use a bar graph, line graph, or pie chart. It can be taught face-to-face as review or assigned in Google Classroom as a sub lesson. This Interactive Assignment covers:⚗️ Bas
Subjects:
Grades:
5th - 10th
Also included in: South Carolina 7th Grade Science CUSTOM Activity Bundle (3)
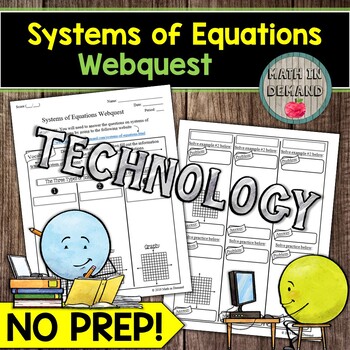
Systems of Equations Webquest Math
Students will need a device for my math webquest on systems of equations. Students will be given a link that goes to my website containing information about the number of solutions (no solution, one solution, and infinitely many solutions), and how to determine the number of solutions by using graphing, substitution, and elimination. I have included a worksheet that aligns to the information on my website. All you need to do is print and go! In addition, there is a 10 problem quiz on my website.
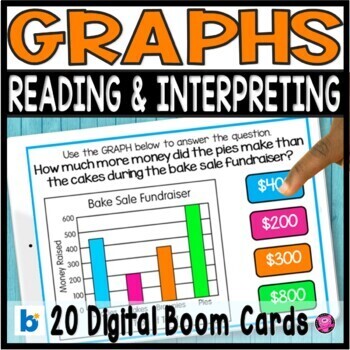
Bar Graphs and Picture Graphs Reading & Analyzing Data Digital Boom Cards
Teaching second and third grade students how to read and interpret data, solve one- and two-step "how many more" and "how many less" problems using information presented in scaled bar graphs will be fun and engaging using these 20 DIGITAL Boom math tasks! Students will practice common core 3.MD.B.3 graphing activities using multiple representations of graphs including data tables, bar graphs, line graphs, and pie graphs. The questions are differentiated for a wide range of learners.Click here to
Subjects:
Grades:
2nd - 3rd
Types:
Also included in: Graphing and Date Analysis Reading and Interpreting Graphs and Data
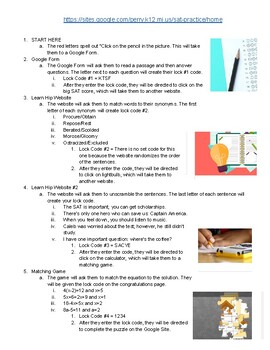
SAT Escape Room
This activity can be used to help review for the PSAT or SAT. Please note that this is not an in-depth review. It's just supposed to be a more fun way to practice the concepts found on the SAT. I would use this more for underclassmen rather than juniors. This activity will take about 45-50 minutes for students to complete. There are 6 sections. One for each section of the SAT.Reading: Read a short passage and answer questions.Words in Context: Match synonyms.Grammar: Unscramble sentences using p
Grades:
9th - 12th
Types:
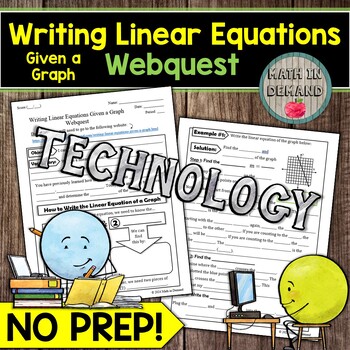
Writing Linear Equations Given a Graph Webquest
Students will need a device for my math webquest on writing linear equations given a graph. Students will be given a link that goes to my website containing information about how to write the linear equation of a graph. Students will learn how to: (1) determine the slope of a graph, (2) find the y-intercept of a graph, and (3) write the equation of the linear graph using the slope-intercept form equation. I have included a worksheet that aligns to the information on my website. All you need to d
Grades:
8th
Types:

Webquest Investigation - Slope of a Line
Using a free online graphing calculator, students explore relationships between linear equations, their graphs, and the slopes of the lines. By the end of this investigation, students will discover relationships between parallel lines, perpendicular lines, and their slopes. Enjoy!
Subjects:
Grades:
7th - 11th, Adult Education
Types:
Coordinate Plane Escape Room | Graphing Digital Breakout
Make your Coordinate Plane lessons more fun with with this engaging, digital escape room! This escape room includes 9 critical thinking and puzzle locks perfect for sharpening research skills and a never give up attitude. Quick and easy setup plus clear student directions make this activity perfect for individuals, groups, or even substitute days, too! Did I mention that this breakout is editable?!? Use as is, add, or subtract questions and then post the link through Google Classroom, a class w
Subjects:
Grades:
5th - 8th
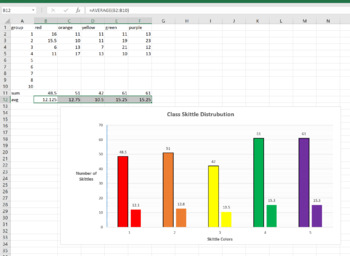
Skittle Statistics MS Excel Mini-Lab
This is a 1 class MS Excel lab for a computer or math class. You can have the students explore the distribution of different color Skittles in class. This is a great mini-lab or half-day activity when you school ends up with a weird schedule day. Tell them they can't eat till the Skittles till the end of class, or they will distort their numbers. Also make sure they don't throw them or shove them up their nose (Yes, stuck Skittles are hard to extract, ask me how I know..)The goal of this lab is
Grades:
6th - 12th, Higher Education, Adult Education
Types:
NGSS:
MS-ETS1-2
, HS-ETS1-2
, HS-ETS1-3
, MS-ETS1-4
, MS-ETS1-1
...
Also included in: Hands-on Science Semester Labs Bundle

AP Human Geography 4.3 Political Power & Territoriality WebQuest & Assessment
A short webquest activity that can be used to introduce or review topic 4.3 Political Power and Territoriality. Includes webquest, links, answer key, 6 AP style multiple choice questions, and a 4-part Free Response Stimulus Based Question.
Subjects:
Grades:
9th - 11th
Types:
Also included in: 12 AP Human Geography WebQuests
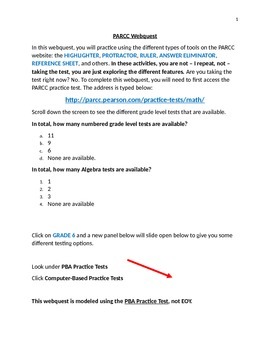
PARCC test prep webquest - MATHEMATICS
Want your students to become familiar with the PARCC assessment in a low-pressure activity? Want your students to be worry-free around taking a test on the computer? This webquest emphasizes playing and manipulating the features and tools on the PARCC mathematics practice test website. I created this specialized webquest for my special education students (ASD, PDD-NOS, ADHD, LD) to reduce their anxiety and help familiarize themselves with the format and features of the math test. While exploring
Subjects:
Grades:
5th - 8th
Types:
CAASPP Desmos Practice Tasks
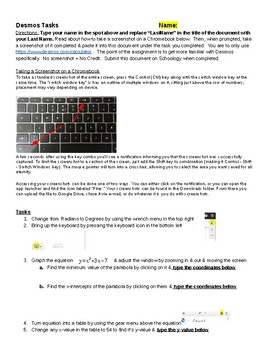
The CAASPP test that our students take is a computer adaptive test that uses the Desmos Calculator (on problems that allow a calc). If your students do not use Desmos beforehand, they will be at a disadvantage. I put together these tasks to walk students through the various functions Desmos can complete. Students answer some questions & take some Screenshots to show the teacher they can now use Desmos. This activity is designed to be completed on a Chromebook or something similar. It is
Subjects:
Grades:
6th - 12th
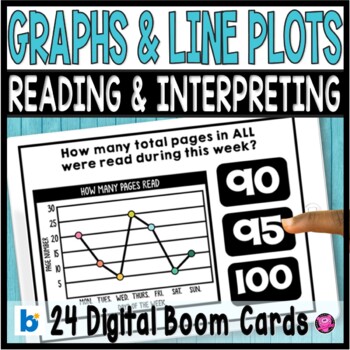
Graphing and Data - Bar Graphs Line Plots Pictographs 3rd Grade DIGITAL Tasks
Teaching your 3rd and 4th grade students how to read, interpret, and analyze dat data using bar graphs, line plots, and picture graphs will simple and easy using these 24 DIGITAL math tasks. Students will practice answering questions like: "how many more", "how many less", and "compare data" using line plots and pictographs. Boom Card can be used with Google Classroom, SeeSaw, ClassDoJo and other platforms. Click here to SAVE 20% on my Graphing Bundle!PLEASE NOTE YOU ARE PURCHASING A LINK TO ACC
Subjects:
Grades:
1st - 3rd
Types:
Also included in: Graphing and Date Analysis Reading and Interpreting Graphs and Data

Misleading Graph WebQuest
This editable Google Doc contains 10 questions and is to be used with the following website:5 Ways Writers Use Misleading Graphs To Manipulate YouI also recommend starting the lesson by showing the following YouTube videos:How to spot a misleading graphHow statistics can be misleading
Subjects:
Grades:
6th - 12th
CCSS:
MCAS 2.0 Webquest - Updated for MCAS 2019!
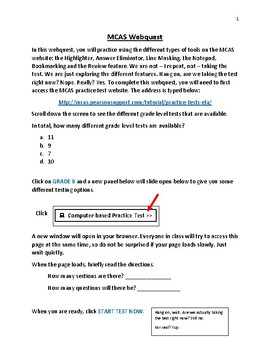
Want your students to become familiar with the new next-generation MCAS assessment in a low-pressure activity? Want your students to be worry-free around taking a test on the computer? This webquest emphasizes playing and manipulating the features and tools on the MCAS practice test website designed by Pearson and PARCC. I created this specialized webquest for my special education students (ASD, PDD-NOS, ADHD, LBLD) to reduce their anxiety and help familiarize themselves with the format and feat
Grades:
5th - 8th
Types:
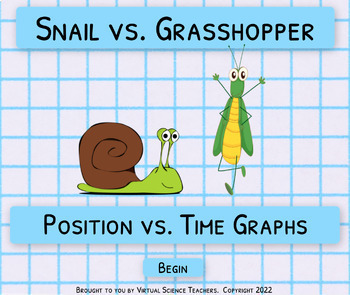
Position vs. Time Graphs: Grasshopper vs. Snail Interactive + Worksheet
This worksheet compliments the free online Virtual Science Teachers Position vs. Time Graphs: Snail vs. Grasshopper interactive. The provided printable graphic can be used in place of using the online interactive.Note: Test out the free part of the activity by clicking on this link. Be sure it works in the classroom and is not blocked by your school district.Students fill out the printed worksheet as they work through the interactive. Please note that the worksheet includes many questions tha
Subjects:
Grades:
5th - 10th
Types:

WWI Bundle
Over 26 assignment that will add variety to any history class!This bundle includes readings, DBQ's, web quest, SAT reading passages, and mapping activities. There are also various ways of fitting this material into your class. Many opportunities for students to work individually, or cooperatively in Kagan structures. SAVE $!!
Grades:
8th - 12th
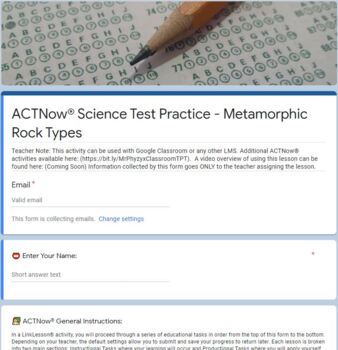
ACTNow® Science Standardized Test Prep Bundle - Online Blended Distance Remote
Description: This bundle presents complete science ACT or SAT test prep lessons including a reading passage and associated sample test questions. Each ACTNow® lesson presents a different style question as either a data representation, research summary, or conflicting viewpoint analysis. Activity can be used as an independently graded activity, or independent work followed by a whole group review to identify areas needing additional practice. All questions are self-grading.
Subjects:
Grades:
7th - 12th, Higher Education, Adult Education
Types:
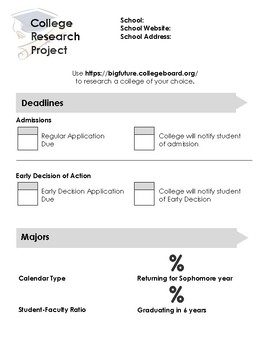
College Research Project
Are your upper elementary students starting to explore college options? This resource allows students to analyze a college/university through College Board. Students will look at a holistic view of the college process for applications to campus life. Research Website: https://bigfuture.collegeboard.org/Topics of Research:DeadlinesMajorsCampus LifeApplyingPayingLeave feedback and receive TPT credit!Build up TPT credit by leaving feedback on our products! Submit feedback at the time of purchase
Grades:
7th - 10th
Types:
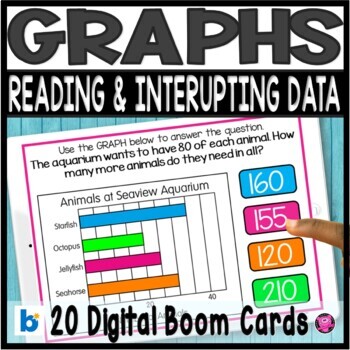
Reading and Interpreting Graphs DIGITAL Task Cards | Graphing
Do your students need teaching and practice activities for reading and interpreting horizontal and vertical bar graphs? This is a set of 20 DIGITAL Boom task cards for students to practice reading and interpreting HORIZONTAL and VERTICAL bar graphs with increments of 5. Students will answer questions like: "how many more", "how many less", and "compare data" about Aquarium Animals. Great for math centers/stations, whole group teaching, small groups, and even assessments! Boom Card can be used wi
Subjects:
Grades:
1st - 4th
Types:
Also included in: Graphing and Date Analysis Reading and Interpreting Graphs and Data
Showing 1-24 of 52 results


