42 results
Elementary statistics simulation activboard activities
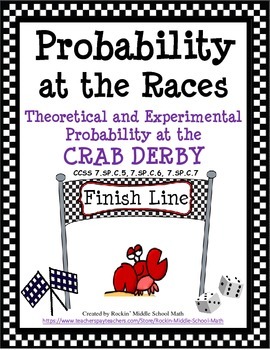
Probability-Theoretical and Experimental-Crab Derby Race CCSS 7.SP.C.5, 6, and 7
This is a fun, engaging 3 part activity including lesson plan that will have your kids so engaged they will forget they are actually learning math. Students will first work in groups/partners and simulate a crab derby race in a game using the sum of two dice to see whose crab will cross the finish line first. Then, they will complete a matrix of possible outcomes when two dice are tossed and added together to get particular sums. They will answer questions that apply to both theoretical and e
Subjects:
Grades:
5th - 9th
Types:
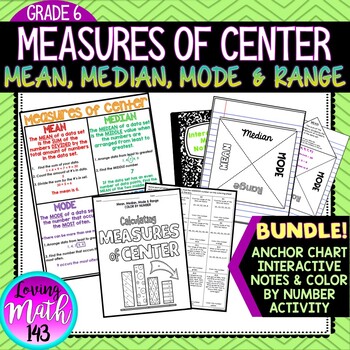
Mean Median Mode and Range Interactive Notes, Poster and Activity BUNDLE
Mean, Median, Mode & Range Color By Number ActivityThis color by number activity is a fun and engaging way for students to practice calculating the measures of center including mean, median, mode and range. Students will solve 16 questions involving mean, median mode, and range then find their answer on the color by number sheet. If their answer is not on the color by number then their answer is not correct. This activity is aligned with the sixth (6th) grade common core standards.WHATS INCL
Subjects:
Grades:
5th - 8th
The Ultimate Basketball Learning Activity & Game - Data Management & Probability
DATA MANAGEMENT AND BASKETBALL!Can be used as a performance task for Data Management and Number Sense and Numeration! Want an exciting and fun activity to get students interested in Data Management? This is the resource for you! Combining competitive gameplay, exciting research, and fun this activity is a surefire way to get your class interested in Data Management. You'll create player profiles and using experimental probability determine the outcome of basketball games played between your
Subjects:
Grades:
5th - 12th, Adult Education
Types:
Categorical Data vs Numerical Data Flip Chart
In this flip chart, students will learn the difference between categorical data and numerical data, examples, and key vocabulary. The activinspire flip chart allows the teacher to reveal the information by removing the shapes over the correct information. At the end of the lesson are five questions which the students have to classify as categorical or numerical.
Grades:
5th - 8th
Types:
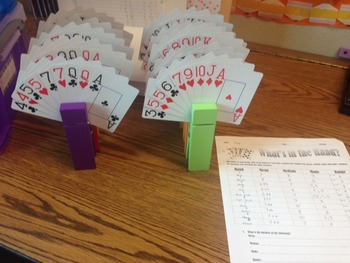
Statistics Mode, Median, Mean, Range Worksheet for Math or Psychology
What's in the Hand: Activity makes learning mode, median, mean, and range fun. You will need two packs of playing cards in order to use 10 different variations. I use giant clothes pins to hold a total of 9 cards for each station. Each student gets a worksheet and is assigned to a group of 4-5 students. Students will complete the first rotation by figuring the mean, median, mode, and range, and then rotate to each other station in about 5 min intervals. At the end they will answer the questions
Subjects:
Grades:
5th - 12th
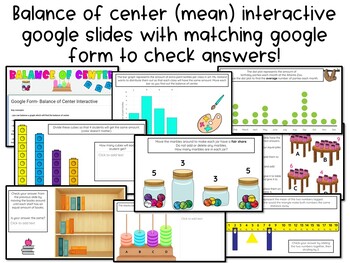
Balance of Center | Mean as Fair Share Interactive Google Slides w/ Google Form
18 slides of different interactive activities giving students an opportunity to move around online math manipulatives to find the balance of center and mean as fair share. There is a google form that goes along with the slides so students can get instant feedback. Examples:- balancing a bar graph- balancing a dot plot- sharing money to find the fair share between four friends- moving marbles around in different jars to find the mean of marbles per jar- moving snap cubes to balance the four grou
Subjects:
Grades:
3rd - 8th
Types:
Which Graph Do I Use to Display Data? Flip Chart
This review of various graphs indicates which graph is best to use for certain types of data. At the end, there is a 10 question multiple choice activote activity where the students are given a situation and have to choose the correct graph to display their data.
Subjects:
Grades:
4th - 8th
Types:
Fantasy Baseball by Josh Hammond
This exciting and interactive unit is based in the Common Core State Standards - specifically covering the Statistics and Probability domain for 6th and 7th grade.
There are 10 lessons in all that teach students about probability, mean and median, statistical variation, and much more. Students will also build a team of players from scratch, participating in a live auction to do so. Students will then play interactive games against each other, and keep track of the player statistics through it a
Subjects:
Grades:
5th - 8th
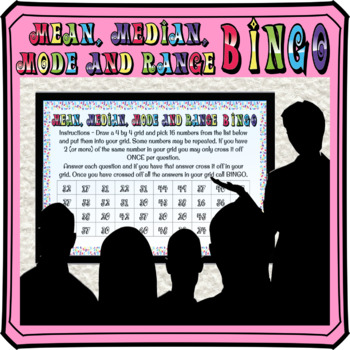
Mean, Median, Mode and Range math BINGO
This mean, median, mode and range activity is a really fun way for students to practice. Skills include finding the mean, median, mode or range from a list of numbers. All give positive integer answers.Show the questions on a Smart Board or projector. Your students will love it and won't realize how many questions they are answering!This product includes:★ A PowerPoint display with instructions, student choice bingo numbers and 40 questions★All 40 numbers on screen for students to make their own
Subjects:
Grades:
5th - 8th
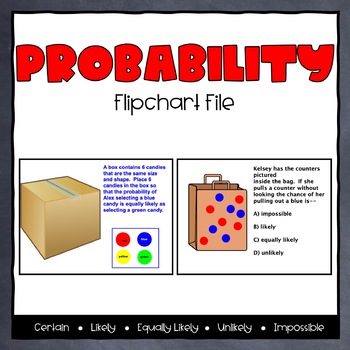
Probability ActivInspire Flipchart
This flipchart has 33 slides that have various types of practice with understanding probability. This flipchart introduces the concept of probability as chance and defines the 5 main descriptor words associated with probability (certain, likely, equally likely, unlikely, and impossible). It reinforces the concepts with examples. It also reviews the probability words and has several multi-step, technology-enhanced examples for student practice.The flipchart is designed for whole-group but coul
Subjects:
Grades:
2nd - 4th
Types:
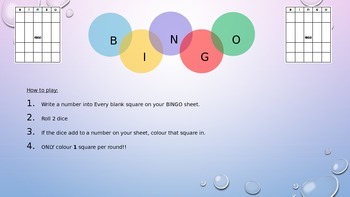
2 Dice Probability Bingo Game
Simple Bingo game where students can use a bingo game as an experiment to discover which values are the highest probability in either the sum of 2 dice or the difference of 2 dice.
Students fill in the sheets with values they think will come up. They get to fill in one square per round if the have a value that matches the sum/difference of the dice. After the first game is played, it should be played again to allow students to use their understanding to improve their chances. Eg. using more
Subjects:
Grades:
5th - 8th
Types:
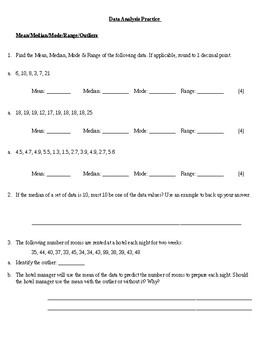
Data Analysis Practice (Mean, Median, Mode, Outliers, Graphing)
Worksheet practicing skills such as:
- Calculating Mean, Median, Mode, Range, Outliers
- Choosing the best graph/measure of central tendency
- Drawing & Analyzing Circe Grapgs
Subjects:
Grades:
5th - 9th
Halloween Party - Math Problem Solving
In this activity, students will be planning a Halloween party for their class. They will need to "purchase" supplies for their party using a budget that you set. I set a budget that forces the students to make budget choices, i.e., I don't give them enough to buy everything they want. Students will work in partners to plan their party, making decisions based on their budget constraints. Students are also asked to perform some data analysis on the party choices. This is a good activity to do
Subjects:
Grades:
3rd - 7th
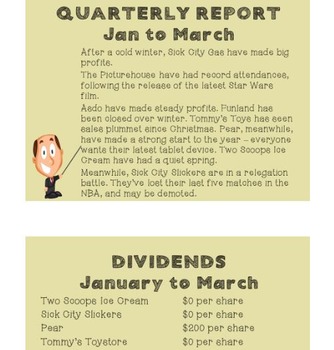
Maths activity: Stock Exchange! (Three lessons)
This maths activity has been used by my class at the end of exams - and it has been one of the most interesting and engaging maths projects I've ever been involved with. There are three years of trading, with each year taking about an hour of class time, or one lesson.
The class is split into teams of three and is given a share in each of eight fictional companies in a city called Sick City.
They then have trading windows where they can exchange their shares for those of other teams, predictin
Subjects:
Grades:
4th - 7th
Types:
Data Fun Powerpoint
This powerpoint includes a TON of different pieces of information about data! The first section introduces mean, median, mode and range with examples then gives the students an opportunity to practice. The second section covers the many different ways to display data, and the third section has several different graphs that the students will need to analyze.
Subjects:
Grades:
4th - 5th
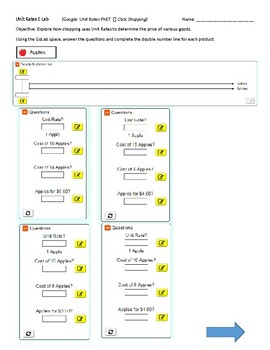
Interactive Online ELab Simulations Lab - Shopping Unit Rates Lab
In this FREE online interactive simulation provided by PhET, developed by the University of Colorado, students will explore unit rates through the process of buying goods. Students will explore how shopping uses unit rates to determine the price of various goods. Students will need a computer, tablet or IPad. These simulations were designed for IPad use. This handout goes directly with the Elab and contains directions on accessing the lab online as well as directions on how to complete the lab.
Subjects:
Grades:
5th - 8th
Types:
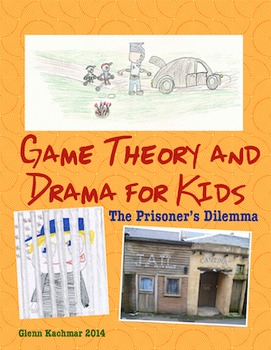
Game Theory and Drama for Kids
Most kids are convinced math is boring. Use drama and humour to get them doing (university level) strategic thinking and have fun at the same time. Game theory is a study of strategic decision making. In this game, kids act out the part of a judge, a bailiff, two criminals and a police officer or two. The goal is to spend as little time in jail as possible. What's the best way to do that? Play the game to find out.
With game theory and some drama thrown in, math truly can be something incredibl
Subjects:
Grades:
3rd - 8th
Types:
Statistical Questions Interactive Presentation - 6.SP.1
Interactive Powerpoint will provide students with definitions, opportunities to differentiate between statistical questions and non-statistical questions and the ability to write statistical questions. The lesson moves step by step through the material in a way that will keep students interested and provide a basis for future learning. Use with smartboard, projector, computer, pad or as printables. Great lesson for cooperative learning or centers.
Objectives:
- Recognize statistical questions
Subjects:
Grades:
5th - 8th
CCSS:
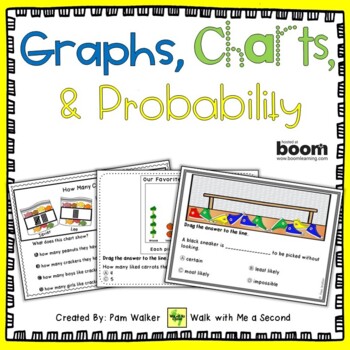
Graphing and Data with Boom Cards
This deck of 30 slides focuses on practice for the reading of charts, graphs, and data with six different presentations of data. This type of reading can be as challenging as text reading without practice.The click-to-answer plus drag-and-drop functions are easy to use for young learners. Like all Boom Cards, the answers are self-checking, so students get immediate feedback. The graph topics are engaging, too. Great for large or small groups, follow-up to lessons, distributive practice, independ
Subjects:
Grades:
1st - 3rd
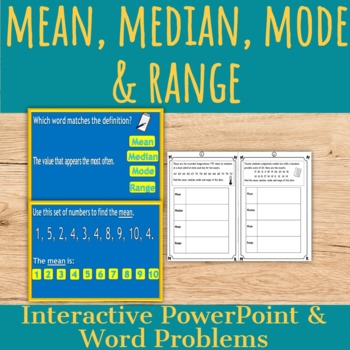
Mean, Median, Mode & Range: Word Problems and PowerPoint
This is a powerpoint activity which includes definitions and examples of mean, median, mode and range followed by an interactive multiple choice quiz.Also included is a worksheet pack of twelve word problems which could be used as a follow up activity. Each problem asks for the calculation of the mean, median, mode and range.
Subjects:
Grades:
5th - 7th
CCSS:
Also included in: 6th Grade Math Bundle
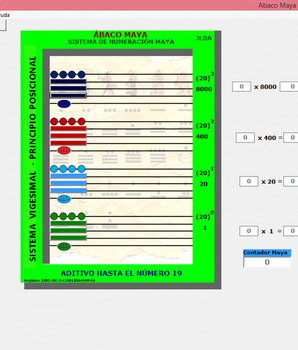
Ábaco Maya Software Interactivo -- Maya Abacus Interactive Software
El sistema de numeración Maya era vigesimal, basado en el número 20, en vez de la base 10 usada actualmente.En este último sistema hay diez cifras diferentes, 0, 1, 2, 3, 4, 5, 6, 7, 8 y 9 que se usan para representar cualquier número como potencias de la base del sistema, el número 10. Por ejemplo, el número 258 significa 2 x 10² + 5 x 101 + 8 x 100, es decir, dos centenas más cinco decenas más 8 unidades.English description:The Maya numbering system was vigesimal, based on the number 20, inste
Subjects:
Grades:
PreK - 3rd
Types:
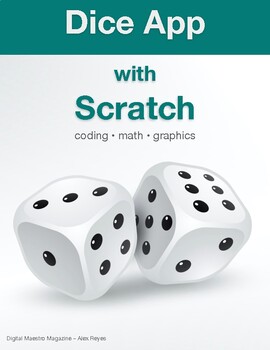
Dice game and app with Scratch (Distance Learning)
In these lessons, you will learn how to create a dice game with Scratch. The game is useful as a random number generator. It is useful when teaching randomness and probability. Students learn coding skills. Students learn to create their own dice face with a free online graphics application. Each lesson comes with detailed step by step instructions.
Grades:
2nd - 12th, Higher Education, Adult Education, Staff
Types:
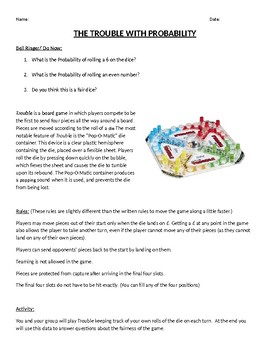
Trouble with Probability
Students will use the popper board game to study the probability of a fair dice.They will play a (speed-up) version of the classic board game to determine how many times each number of a die appears. They will calculate the percentage of occurrence of each number to determine if the die is fair. Follow up questions about how to change the probability of the die are also included as either homework or an extension of the activity.
Subjects:
Grades:
5th - 8th
Types:
CCSS:
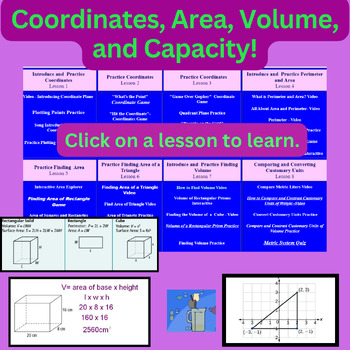
EXPLORING COORDINATES, AREA, VOLUME, CAPACITY! Supports Virtual Learning!
Access practical strategies for learning Coordinate, Area, Volume, and Capacity concepts tailored to diverse learning styles with just one click. Approaches include interactive games, videos, and PowerPoints.This product is a website designed to align with the Coordinate, Area, Volume, and Capacity concepts taught in Unit 9 of Everyday Math curricula for 5th grade. However, it can quickly adapt to other publishers and grade levels that cover similar skills.This resource provides activities for a
Subjects:
Grades:
4th - 6th
Showing 1-24 of 42 results


