45 results
Elementary statistics laboratory activboard activities

Candy Probability: Discovery of EXPERIMENTAL vs. THEORETICAL Probability
Middle Schoolers LOVE probability!
This is a GREAT lesson around Halloween when the kids are already hyped up on sugar and want to 'talk' to their classmates.
This activity allows the students to DISCOVER the differences between EXPERIMENTAL and THEORETICAL probability and connect it to everyday experiences. The probability lesson lends itself to fractions, decimals, percents, data collection, rational & irrational numbers, statistical graphs (box and whiskers, frequency tables...), measu
Subjects:
Grades:
5th - 9th
Types:
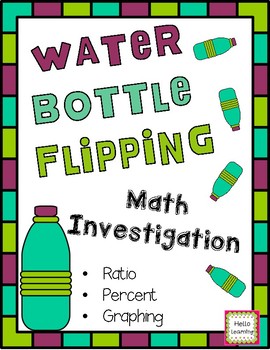
Water Bottle Flipping Investigation
Water bottle flipping- ratio, percent, measurement, data collection and graphing! The kids love bottle flipping and this product will let you bring bottle flipping into your classroom in an educational way!
Students will make predictions about the ideal water level in their water bottle that will result int he most successful flips. They will then record data about their bottle and conduct a variety of trials using different water levels to test their success with flipping their bottle at d
Subjects:
Grades:
5th - 7th
Types:
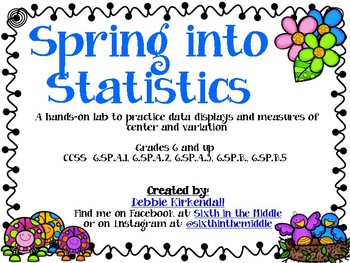
Spring into Statistics Data Displays and Measures of Center Lab
This is a hands-on lab that teaches about Statistical Questions, Data Displays (dot/line plot, histograms, box plots) and Measures of Center (mean, median, mode, and range). The lab includes notes pages, examples with answer keys, and a final project in which the student can survey classmates and create a "flower" by using their data to find mean, median, mode, range. They will also create a box plot, histogram and dot plot.
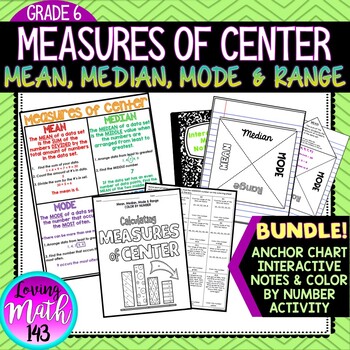
Mean Median Mode and Range Interactive Notes, Poster and Activity BUNDLE
Mean, Median, Mode & Range Color By Number ActivityThis color by number activity is a fun and engaging way for students to practice calculating the measures of center including mean, median, mode and range. Students will solve 16 questions involving mean, median mode, and range then find their answer on the color by number sheet. If their answer is not on the color by number then their answer is not correct. This activity is aligned with the sixth (6th) grade common core standards.WHATS INCL
Subjects:
Grades:
5th - 8th
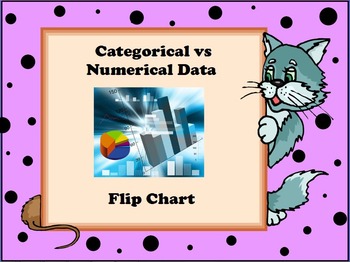
Categorical Data vs Numerical Data Flip Chart
In this flip chart, students will learn the difference between categorical data and numerical data, examples, and key vocabulary. The activinspire flip chart allows the teacher to reveal the information by removing the shapes over the correct information. At the end of the lesson are five questions which the students have to classify as categorical or numerical.
Grades:
5th - 8th
Types:
Which Graph Do I Use to Display Data? Flip Chart
This review of various graphs indicates which graph is best to use for certain types of data. At the end, there is a 10 question multiple choice activote activity where the students are given a situation and have to choose the correct graph to display their data.
Subjects:
Grades:
4th - 8th
Types:
Basketball Statistics Project
Description: Engage your middle school students in the exciting world of basketball while reinforcing math and data analysis skills with this interactive Basketball Stats Project! This comprehensive resource is designed to captivate students' interest in both sports and mathematics, making learning both fun and meaningful.Take your students to the gym or outdoor playground hoop and they'll collect data on "How many baskets can ___ graders make in 60 seconds?" (the template is set to sixth grade
Subjects:
Grades:
5th - 8th
Types:
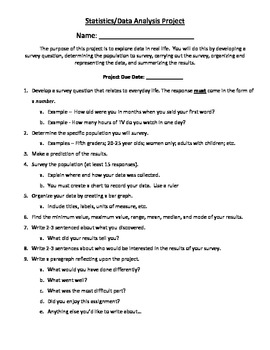
Real-Life Statistics Project
Students must think of a survey question that can be answered numerically. Then, they must go out into their community or school and ask at least 15 people their question. After collecting their data, they must find the minimum, maximum, range, mean, median, and mode. Also, they must graph their results, and answer a few reflection questions about their data.
I have my kids put all of this information on a poster or make a powerpoint presentation to show the class. I find this activity re
Subjects:
Grades:
4th - 8th
Types:
Mean, Median, Mode and Range math BINGO
This mean, median, mode and range activity is a really fun way for students to practice. Skills include finding the mean, median, mode or range from a list of numbers. All give positive integer answers.Show the questions on a Smart Board or projector. Your students will love it and won't realize how many questions they are answering!This product includes:★ A PowerPoint display with instructions, student choice bingo numbers and 40 questions★All 40 numbers on screen for students to make their own
Subjects:
Grades:
5th - 8th

Water Filtration
Students are challenged to filter contaminated water for safe consumption using their own designs. 3D print and non-3D print options included. Students will also experience a complete engineering design process, collect and analyze data, and will share their results and finally reflect on their experience. Teacher and student instructions included. Developed by a team of engineers and teachers.
Subjects:
Grades:
PreK - 5th
Types:
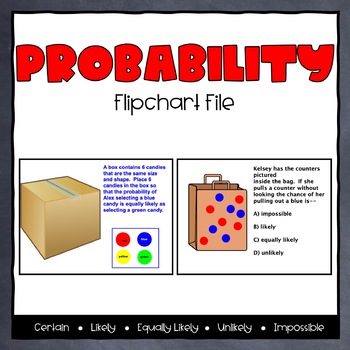
Probability ActivInspire Flipchart
This flipchart has 33 slides that have various types of practice with understanding probability. This flipchart introduces the concept of probability as chance and defines the 5 main descriptor words associated with probability (certain, likely, equally likely, unlikely, and impossible). It reinforces the concepts with examples. It also reviews the probability words and has several multi-step, technology-enhanced examples for student practice.The flipchart is designed for whole-group but coul
Subjects:
Grades:
2nd - 4th
Types:
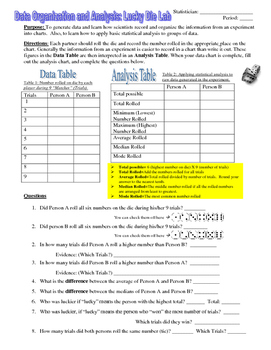
Data Organization and Statistical Analysis Activity: Lucky Die Lab
An engaging way for students to learn about how scientists generate data and make meaning of that data using statistical tools. Featured Concepts:Data Organization in TablesData Analysis Using Measures of Central Tendency: Mean, Median and Mode. NGSS Science and Engineering Practice: Using mathematics and computational thinkingMaterials needed in addition to the handouts: Dice (one per student dyad)Includes bonus second page featuring analysis of experimental design, with opportunities for fur
Subjects:
Grades:
5th - 8th
Types:
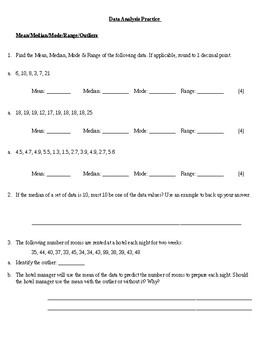
Data Analysis Practice (Mean, Median, Mode, Outliers, Graphing)
Worksheet practicing skills such as:
- Calculating Mean, Median, Mode, Range, Outliers
- Choosing the best graph/measure of central tendency
- Drawing & Analyzing Circe Grapgs
Subjects:
Grades:
5th - 9th
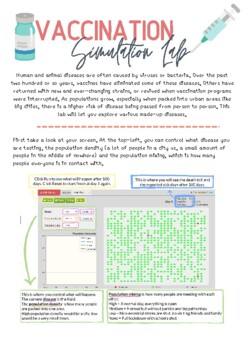
COVID-19 Simulation Lab
Students go to the following website and follow the guide to answer the questions. They look specifically at why social distancing and staying at home works, how population density affects the spread of a virus and how vaccinations can slow the spread. They will answer questions about their thoughts on vaccinations and if they should be required to have one. Website: https://www.learner.org/wp-content/interactive/envsci/disease/disease.html
Grades:
5th - 12th
Types:
NGSS:
HS-LS4-6
, HS-LS4-3
, MS-LS4-4
, MS-LS4-6
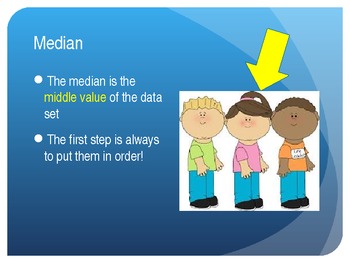
Data Fun Powerpoint
This powerpoint includes a TON of different pieces of information about data! The first section introduces mean, median, mode and range with examples then gives the students an opportunity to practice. The second section covers the many different ways to display data, and the third section has several different graphs that the students will need to analyze.
Subjects:
Grades:
4th - 5th
Statistical Questions Interactive Presentation - 6.SP.1
Interactive Powerpoint will provide students with definitions, opportunities to differentiate between statistical questions and non-statistical questions and the ability to write statistical questions. The lesson moves step by step through the material in a way that will keep students interested and provide a basis for future learning. Use with smartboard, projector, computer, pad or as printables. Great lesson for cooperative learning or centers.
Objectives:
- Recognize statistical questions
Subjects:
Grades:
5th - 8th
CCSS:
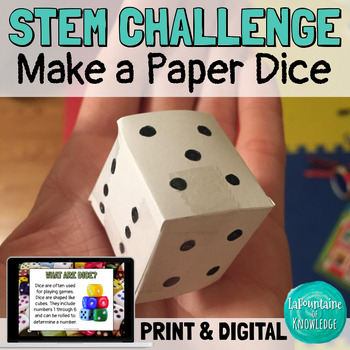
STEM Challenge Make a Paper Dice Geometry Lab Experiment PRINT and DIGITAL
In this STEM challenge, students create and test a paper die. They learn about dice and how their cube shape allows them to land on random numbers each time they are rolled. This hands on science lab activity incorporates geometry (3D shapes) and probability with engineering and design. This resource includes: teacher directions, discussion questions, and extension activitiesbackground information about dice and how they workan introduction to the challenge to get students starteda student respo
Subjects:
Grades:
3rd - 6th
Types:
NGSS:
3-5-ETS1-3
, 3-5-ETS1-1
, 3-5-ETS1-2
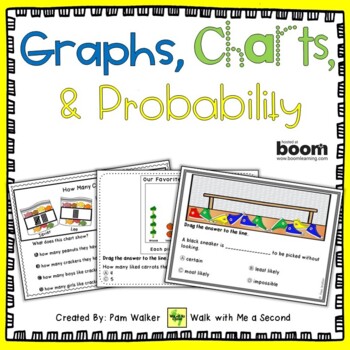
Graphing and Data with Boom Cards
This deck of 30 slides focuses on practice for the reading of charts, graphs, and data with six different presentations of data. This type of reading can be as challenging as text reading without practice.The click-to-answer plus drag-and-drop functions are easy to use for young learners. Like all Boom Cards, the answers are self-checking, so students get immediate feedback. The graph topics are engaging, too. Great for large or small groups, follow-up to lessons, distributive practice, independ
Subjects:
Grades:
1st - 3rd
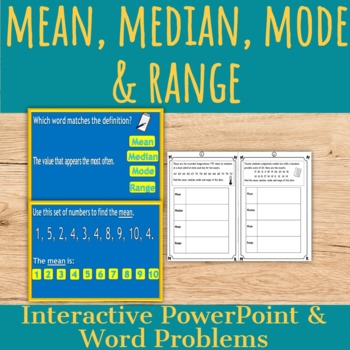
Mean, Median, Mode & Range: Word Problems and PowerPoint
This is a powerpoint activity which includes definitions and examples of mean, median, mode and range followed by an interactive multiple choice quiz.Also included is a worksheet pack of twelve word problems which could be used as a follow up activity. Each problem asks for the calculation of the mean, median, mode and range.
Subjects:
Grades:
5th - 7th
CCSS:
Also included in: 6th Grade Math Bundle
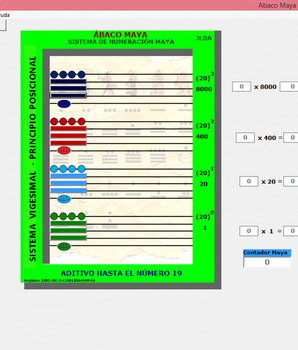
Ábaco Maya Software Interactivo -- Maya Abacus Interactive Software
El sistema de numeración Maya era vigesimal, basado en el número 20, en vez de la base 10 usada actualmente.En este último sistema hay diez cifras diferentes, 0, 1, 2, 3, 4, 5, 6, 7, 8 y 9 que se usan para representar cualquier número como potencias de la base del sistema, el número 10. Por ejemplo, el número 258 significa 2 x 10² + 5 x 101 + 8 x 100, es decir, dos centenas más cinco decenas más 8 unidades.English description:The Maya numbering system was vigesimal, based on the number 20, inste
Subjects:
Grades:
PreK - 3rd
Types:
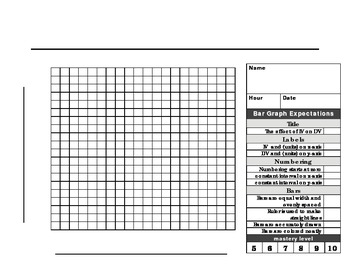
Bar Graph paper and rubric
This 20 X 20 graph paper with rubric is made for a beginner scientist to make a the perfect BAR graph. The checklist format makes it easy for students to know what is expected when graphing. Enjoy!
Subjects:
Grades:
1st - 12th, Higher Education, Adult Education
Types:
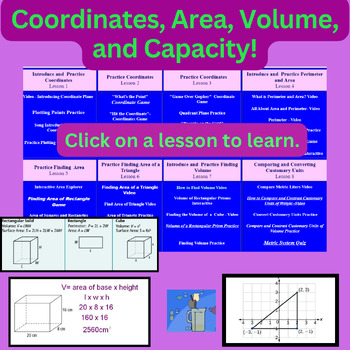
EXPLORING COORDINATES, AREA, VOLUME, CAPACITY! Supports Virtual Learning!
Access practical strategies for learning Coordinate, Area, Volume, and Capacity concepts tailored to diverse learning styles with just one click. Approaches include interactive games, videos, and PowerPoints.This product is a website designed to align with the Coordinate, Area, Volume, and Capacity concepts taught in Unit 9 of Everyday Math curricula for 5th grade. However, it can quickly adapt to other publishers and grade levels that cover similar skills.This resource provides activities for a
Subjects:
Grades:
4th - 6th
Types of Graphs and Their Uses Flip Chart
This lesson discusses the definition of various types of graphs and their uses. Included topics: bar graphs, double bar graphs, line graphs, circle graphs, pictographs, and more.
Subjects:
Grades:
4th - 8th
Types:
Reading & Creating Circle Graphs Flip Chart
This lesson involves reading and creating circle graphs. It includes key vocabulary, steps to reading a circle graph, and how circle graphs are created. It also includes examples of open response questions for reading and interpreting circle graphs.
Subjects:
Grades:
4th - 8th
Types:
Showing 1-24 of 45 results


