13 results
Adult education statistics research under $5
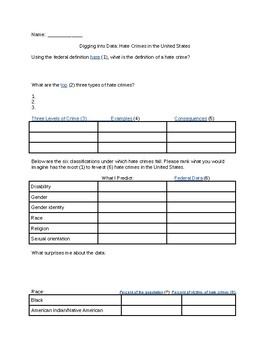
The 57 Bus- Looking at Hate Crime Data
A guided web search on hate crime data from the FBI, CDC, Pew Research Center, and U.S. Census Bureau. Uses reflection questions to make conclusions and predictions about the distribution of hate crimes. The kids are fascinated by the data!
Subjects:
Grades:
7th - 12th, Higher Education, Adult Education
Types:
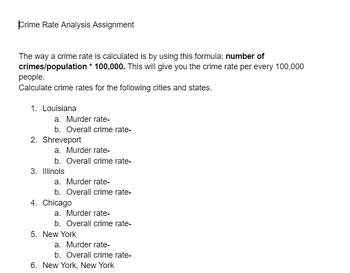
Crime Rate Analysis Assignment
A web based assignment to allow students to calculate the crime rates of various U.S. cities.
Grades:
5th - 12th, Higher Education, Adult Education
Types:
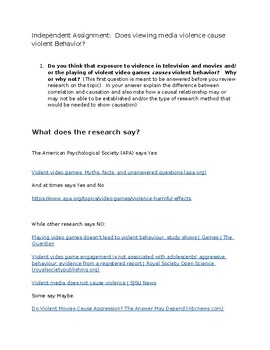
Does viewing media violence cause violent behavior? What does the research say?
This product asks students to weigh in on the possible causal connection between exposure to violent media and violent behavior. Students are asked to state their thoughts both prior to and after reviewing the existing literature on the topic. Research articles present arguments both affirming and denying the causal connection. Multiple meta-analysis article links are also provided. Students are asked to note if their stance on the issue changed after viewing the research and to explain why
Subjects:
Grades:
9th - 12th, Higher Education, Adult Education
Types:
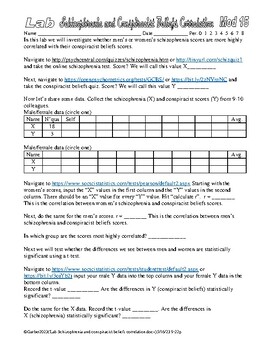
Psychology Schizophrenia and Conspiracist Beliefs Scores Correlation Statistics
In this lab we are finding out if men’s or women’s schizophrenia and conspiracist belief scores are more highly correlated.Students do the schizophrenia quizzes and conspiracist beliefs quiz, collaborate and share data then use a website to conduct the data analysis. It is inspired by this collection… https://www.teacherspayteachers.com/Product/Psychology-Lab-Trolley-Problem-Psychopathy-Scores-Correlation-Statistics-9499523 and the other correlation stuff I have set up…(I have a bunch, these are
Subjects:
Grades:
9th - 12th, Adult Education
Types:
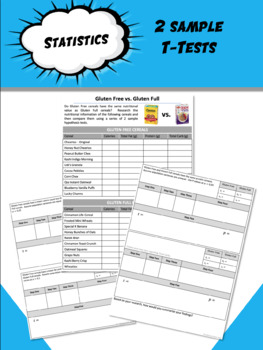
Gluten Free v Gluten Full--2 Sample T Tests
This is math in the REAL WORLD! Part one: Collect DataThe quality and integrity of statistics rests upon the accuracy of your dataPart two: Analyze DataStudents compare Calories, Protein Content, and Fat using 2-sample t-tests. Part Three: Create Your OwnIt's important for students to create and analyze their own research questions, so this give them a chance to come up with a question regarding the Carb content of cereals. *Model answer key is included, but data can vary!
Subjects:
Grades:
10th - 12th, Higher Education, Adult Education
Types:
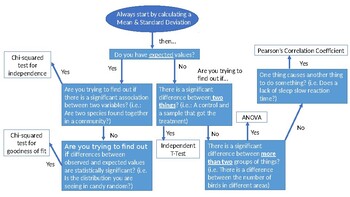
IB Biology: Internal Assessment Statistical Analysis Decision Tree
This product is a PowerPoint slide that can be modified to meet your needs and saved as a PDF to digitally provide to students. I had noticed that my students struggled with determining which statistical analysis was most appropriate for their Internal Assessment, so I created a decision tree for them. By being able to answer the questions on the decision tree, they will be able to appropriately analyze their data and reach their conclusion.
Subjects:
Grades:
11th - 12th, Higher Education, Adult Education
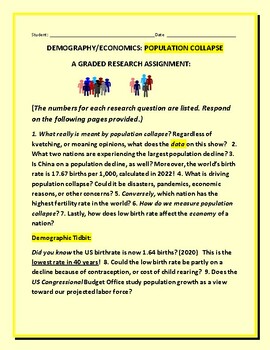
POPULATION COLLAPSE
This research assignment opens the eyes of students as to where we stand insofar as population collapse is concerned. Are we really aware of the consequences that are economic as well? This is a graded assignment. This assignment grade crosses over into demography (social studies), and economics. Thanks for visiting and supporting our humble shop. Excelsior! Statistics give birth to planning and development!
Subjects:
Grades:
9th - 12th, Higher Education, Adult Education, Staff

Census Demographic Data Internet Activity and Activity
Students collect, analyze and investigate Demographic Census Data in a compounding assignment mad for online activities or project based presentations.. Students will find resources and information from online examples to demonstrate their understanding and analysis about topics and issues on political demography. Independent or group based activity made for online or in person completion of activity. Self guided instructions with links and resources included for students to use as necessary to
Grades:
9th - 12th, Higher Education, Adult Education
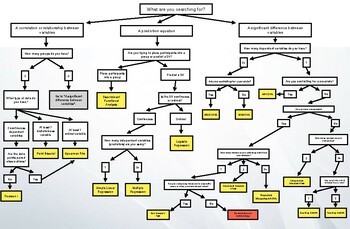
Statistical Analysis Flowchart
Need help figuring out which statistical test to use to answer your research question? This flowchart will help you decide by following a series of arrows regarding your question.
Subjects:
Grades:
9th - 12th, Higher Education, Adult Education, Staff

Ethics and Research: Special Problems and Ethical Issues in Research
Research in child and family investigates dispositional, experiential, and environmental factors that contribute to physical, mental, emotional, and social development in human beings during the early years of life course. As Eunice Kennedy Shriver’s National Institute of Child Health and Human Development puts it “The overall goals of Child and Family Research are to describe, analyze, and assess the capabilities and proclivities of developing human beings, including their genetic characteristi
Grades:
Higher Education, Adult Education, Staff
3D Editable Radial Diagram - Google Slide and Google Sheet files
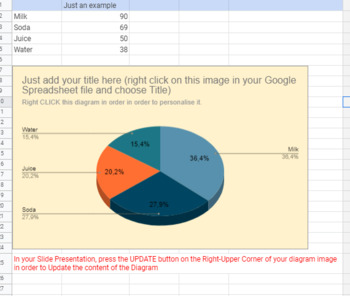
With this 3D Editable Radial Diagram you can easily prepare your diagram presentations and you can use them in almost any activity. Be creative!Useful for any teacher that wants to explain and demonstrate what is a diagram, why and when people are using it. Radial Diagrams help you and your students visualize the results, learn fractions, etc.This is an editable Radial Diagram. You will get 1 Google Spreadsheet File and 1 Google Slide file. You will edit all the data in the Spreadsheet and you w
Subjects:
Grades:
1st - 12th, Higher Education, Adult Education, Staff
Editable Double Column Chart Diagram for Digital Learning - Google Slide
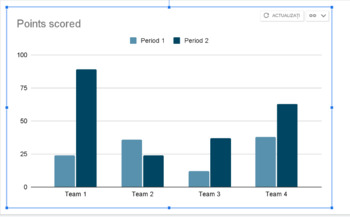
With this Editable Double Column Chart Diagram for Digital Learning you can easily prepare your column chart diagram presentations and you can use them in almost any activity. Be creative!Useful for any teacher that wants to explain and demonstrate what is a column chart diagram, why and when people are using it. Column chart Diagrams help you and your students visualize the results, read diagram charts, etc.This is an editable Column Chart Diagram. You will get 1 Google Spreadsheet File and 1 G
Subjects:
Grades:
1st - 12th, Higher Education, Adult Education, Staff
Editable Chart Diagram - One Column - for Digital Learning - Google Slide
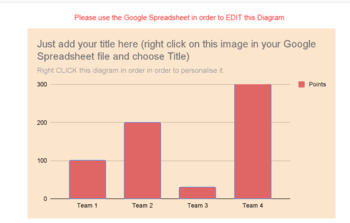
With this Editable One Column Chart Diagram for Digital Learning you can easily prepare your column chart diagram presentations and you can use them in almost any activity. Be creative!Useful for any teacher that wants to explain and demonstrate what is a column chart diagram, why and when people are using it.Column chart Diagrams help you and your students visualize the results, read diagram charts, etc. Very helpful for math activities and statistics.This is an editable Column Chart Diagram. Y
Subjects:
Grades:
1st - 12th, Higher Education, Adult Education, Staff
Types:
Showing 1-13 of 13 results


