30 results
Adult education statistics research
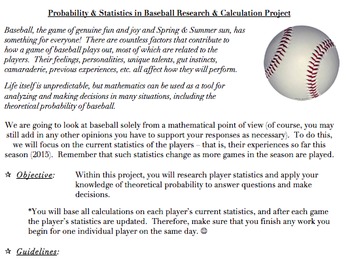
Probability & Statistics in Baseball Project (Common Core Aligned, AND FUN!)
The problems and activities within this document are designed to assist students in achieving the following standards: 6.SP.B.5, 7.SP.C, HSS.CP.A.2, HSS.CP.A.3, HSS.CP.B.7, HSS.CP.B.9, as well as the standards for mathematics practice and the literacy standards. They are also designed to help the teacher assess the students’ abilities when it comes to working with the ideas within the standards.This document contains the following:A project designed to allow students to investigate theoretical
Subjects:
Grades:
5th - 12th, Higher Education, Adult Education, Staff
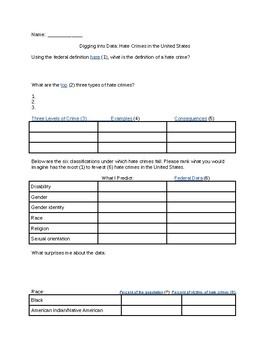
The 57 Bus- Looking at Hate Crime Data
A guided web search on hate crime data from the FBI, CDC, Pew Research Center, and U.S. Census Bureau. Uses reflection questions to make conclusions and predictions about the distribution of hate crimes. The kids are fascinated by the data!
Subjects:
Grades:
7th - 12th, Higher Education, Adult Education
Types:
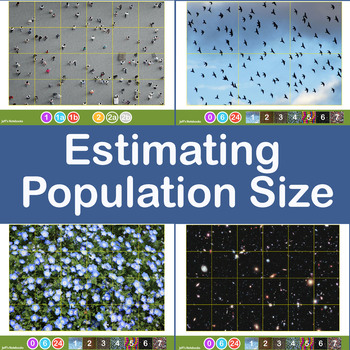
Estimating Crowd and Population Size using Jacob's Method
This investigation delves into estimating the size of a large population of objects by taking a sample and applying some basic mathematics. It encourages sharing of data, refining methods of collection of the data and discussion about the accuracy and limitations of the method used.Jacob's Method of counting large numbers of objects is simple. Draw a grid dividing the area covered into equal size squares. Estimate (by counting) the population of one grid then multiply this by the number of squar
Subjects:
Grades:
6th - 11th, Higher Education, Adult Education
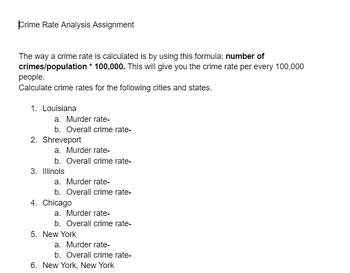
Crime Rate Analysis Assignment
A web based assignment to allow students to calculate the crime rates of various U.S. cities.
Grades:
5th - 12th, Higher Education, Adult Education
Types:
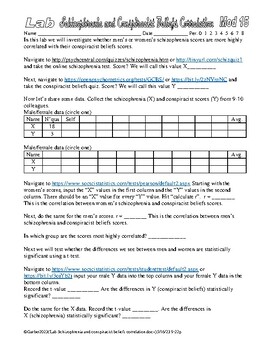
Psychology Schizophrenia and Conspiracist Beliefs Scores Correlation Statistics
In this lab we are finding out if men’s or women’s schizophrenia and conspiracist belief scores are more highly correlated.Students do the schizophrenia quizzes and conspiracist beliefs quiz, collaborate and share data then use a website to conduct the data analysis. It is inspired by this collection… https://www.teacherspayteachers.com/Product/Psychology-Lab-Trolley-Problem-Psychopathy-Scores-Correlation-Statistics-9499523 and the other correlation stuff I have set up…(I have a bunch, these are
Subjects:
Grades:
9th - 12th, Adult Education
Types:
e-Learning AnEconomist Online Course Coupen
Please email this Coupen: TEACHPAYCOUP when you register for the courses in Econometrics, Stata, Matlab, SPSS, Eviews and R. You get 100GBP off the portal fee. Register on http://elearning.aneconomist.com and email on moodle@aneconomist.com ask for discounted invoice for your course. All courses are offered Online, Live and Personalized. Each lecture is recorded and recordings DVD will be provided after the course is completed.
Grades:
11th - 12th, Higher Education, Adult Education, Staff
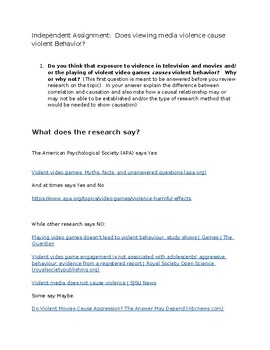
Does viewing media violence cause violent behavior? What does the research say?
This product asks students to weigh in on the possible causal connection between exposure to violent media and violent behavior. Students are asked to state their thoughts both prior to and after reviewing the existing literature on the topic. Research articles present arguments both affirming and denying the causal connection. Multiple meta-analysis article links are also provided. Students are asked to note if their stance on the issue changed after viewing the research and to explain why
Subjects:
Grades:
9th - 12th, Higher Education, Adult Education
Types:
Analyzing and Interpreting Quantitative Data Assessment
This product contains a set of 26 multiple-choice questions focused on quantitative data analysis. It is designed for educators, researchers, and students who want to test their knowledge or prepare for exams in this field.Each question is structured to test the reader's understanding of a specific aspect of quantitative data analysis. The questions cover a range of topics, including statistical software selection, data cleaning, missing data, hypothesis testing, and effect size.The questions ar
Subjects:
Grades:
11th - 12th, Higher Education, Adult Education
Types:
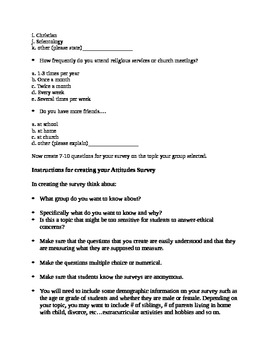
Research Paper-integrating Math and Science
This is a research paper that breaks down the topic and methodology into sections. The project is student driven. Student groups decide on a reseach topic that they can actually research but also create a survey to administer to students in the school so that they are collecting their own data.
The booklet begins with students creating survey questions, but you may want to first have them do the intro to the paper and their hypotheses before creating the survey questions.
Science is integrate
Subjects:
Grades:
7th - 12th, Adult Education
Types:
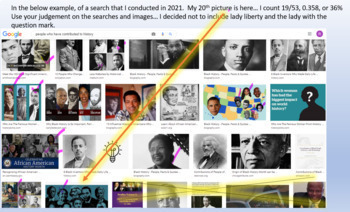
Women's History Month Probability Project
Students learn about suffrage and representatio of women. Students conduct Google searches on favorite subject, sport/hobby, future career and find the probability of a woman appearing in the first 20 images. Students make conjectures about representation of women in those areas. Students identify women they admire and create a video summarizing their findings.Can be adapted to images for African Americans for Black History Month, Hispanic Americans for Hispanic Heritage Month, etc.
Subjects:
Grades:
6th - 12th, Adult Education, Staff
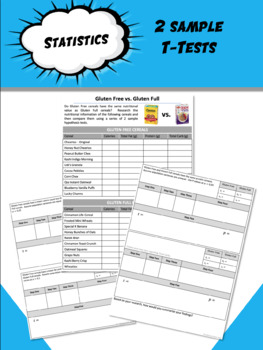
Gluten Free v Gluten Full--2 Sample T Tests
This is math in the REAL WORLD! Part one: Collect DataThe quality and integrity of statistics rests upon the accuracy of your dataPart two: Analyze DataStudents compare Calories, Protein Content, and Fat using 2-sample t-tests. Part Three: Create Your OwnIt's important for students to create and analyze their own research questions, so this give them a chance to come up with a question regarding the Carb content of cereals. *Model answer key is included, but data can vary!
Subjects:
Grades:
10th - 12th, Higher Education, Adult Education
Types:
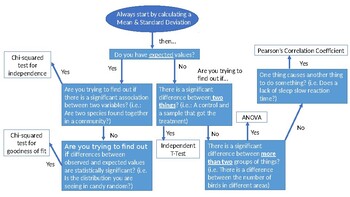
IB Biology: Internal Assessment Statistical Analysis Decision Tree
This product is a PowerPoint slide that can be modified to meet your needs and saved as a PDF to digitally provide to students. I had noticed that my students struggled with determining which statistical analysis was most appropriate for their Internal Assessment, so I created a decision tree for them. By being able to answer the questions on the decision tree, they will be able to appropriately analyze their data and reach their conclusion.
Subjects:
Grades:
11th - 12th, Higher Education, Adult Education
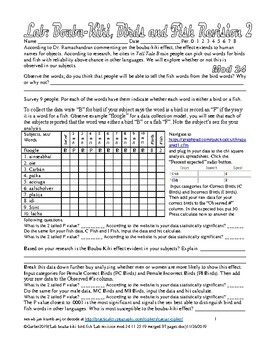
Psychology Lab Bouba Kiki Bird Fish lab Cognition Language
According to Dr. Ramachandran, commenting on synesthesia and the bouba-kiki effect, the effect extends to human names for objects. According to research he cites in Tell Tale Brain, people can pick out words for birds and fish with reliability above chance in other languages. We will explore whether or not this is observed in our population.Survey 24 non-psych friends. For each of the words have them indicate whether each word is either a bird or a fish.This is cool because my students almost al
Subjects:
Grades:
9th - 12th, Higher Education, Adult Education
Types:
A Statistics Glossary with Symbols and Formulas
This is a very comprehensive statistics glossary from A to Z with a number of statistical symbols and formulas. It can be used as a resource book for any form of statistics in high school, undergraduate or graduate levels.
Subjects:
Grades:
9th - 12th, Higher Education, Adult Education, Staff
POPULATION COLLAPSE
This research assignment opens the eyes of students as to where we stand insofar as population collapse is concerned. Are we really aware of the consequences that are economic as well? This is a graded assignment. This assignment grade crosses over into demography (social studies), and economics. Thanks for visiting and supporting our humble shop. Excelsior! Statistics give birth to planning and development!
Subjects:
Grades:
9th - 12th, Higher Education, Adult Education, Staff

Census Demographic Data Internet Activity and Activity
Students collect, analyze and investigate Demographic Census Data in a compounding assignment mad for online activities or project based presentations.. Students will find resources and information from online examples to demonstrate their understanding and analysis about topics and issues on political demography. Independent or group based activity made for online or in person completion of activity. Self guided instructions with links and resources included for students to use as necessary to
Grades:
9th - 12th, Higher Education, Adult Education
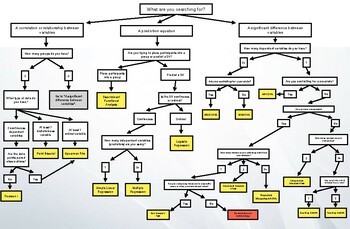
Statistical Analysis Flowchart
Need help figuring out which statistical test to use to answer your research question? This flowchart will help you decide by following a series of arrows regarding your question.
Subjects:
Grades:
9th - 12th, Higher Education, Adult Education, Staff

Ethics and Research: Special Problems and Ethical Issues in Research
Research in child and family investigates dispositional, experiential, and environmental factors that contribute to physical, mental, emotional, and social development in human beings during the early years of life course. As Eunice Kennedy Shriver’s National Institute of Child Health and Human Development puts it “The overall goals of Child and Family Research are to describe, analyze, and assess the capabilities and proclivities of developing human beings, including their genetic characteristi
Grades:
Higher Education, Adult Education, Staff
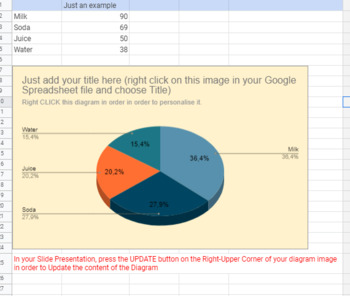
3D Editable Radial Diagram - Google Slide and Google Sheet files
With this 3D Editable Radial Diagram you can easily prepare your diagram presentations and you can use them in almost any activity. Be creative!Useful for any teacher that wants to explain and demonstrate what is a diagram, why and when people are using it. Radial Diagrams help you and your students visualize the results, learn fractions, etc.This is an editable Radial Diagram. You will get 1 Google Spreadsheet File and 1 Google Slide file. You will edit all the data in the Spreadsheet and you w
Subjects:
Grades:
1st - 12th, Higher Education, Adult Education, Staff
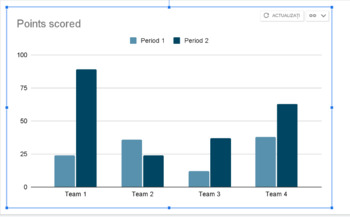
Editable Double Column Chart Diagram for Digital Learning - Google Slide
With this Editable Double Column Chart Diagram for Digital Learning you can easily prepare your column chart diagram presentations and you can use them in almost any activity. Be creative!Useful for any teacher that wants to explain and demonstrate what is a column chart diagram, why and when people are using it. Column chart Diagrams help you and your students visualize the results, read diagram charts, etc.This is an editable Column Chart Diagram. You will get 1 Google Spreadsheet File and 1 G
Subjects:
Grades:
1st - 12th, Higher Education, Adult Education, Staff
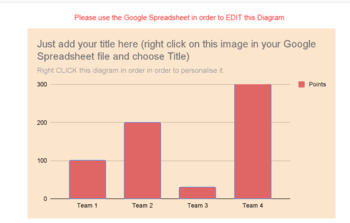
Editable Chart Diagram - One Column - for Digital Learning - Google Slide
With this Editable One Column Chart Diagram for Digital Learning you can easily prepare your column chart diagram presentations and you can use them in almost any activity. Be creative!Useful for any teacher that wants to explain and demonstrate what is a column chart diagram, why and when people are using it.Column chart Diagrams help you and your students visualize the results, read diagram charts, etc. Very helpful for math activities and statistics.This is an editable Column Chart Diagram. Y
Subjects:
Grades:
1st - 12th, Higher Education, Adult Education, Staff
Types:
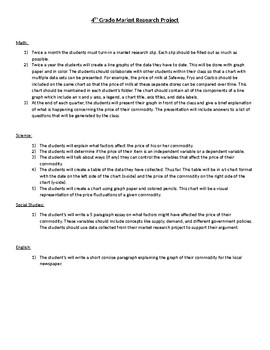
Market Research Project
This is a great project I am currently working on with my 4th grade students. We signed up to research various products that are commonly bought at the supermarket. Some of the items we are researching include spinach, milk, wheat bread, turkey, cheese, and peanut butter. Every other week we collect data by shopping or calling the store. We record the date the information is collected, the quantity of the product (ounces or fluid ounces), and the price of the product. We use this information to
Subjects:
Grades:
4th - 9th, Adult Education
Passion-Driven Statistics E-book (Introductory/AP Statistics Course Textbook)
Passion-Driven Statistics is an NSF-funded, multidisciplinary, project-based curriculum that supports students in conducting data-driven research, asking original questions, and communicating methods and results using the language of statistics. The curriculum supports students to work with existing data covering psychology, health, earth science, government, business, education, biology, ecology and more. From existing data, students are able to pose questions of personal interest and then use
Subjects:
Grades:
6th - 12th, Higher Education, Adult Education
Types:
SPSS software Secondary Data Analysis Workshop (Introductory/AP Statistics)
This handout is intended for those interested in teaching/learning basic introductory statistics concepts to analyze real data. Students will learn how to tell a story using secondary data analysis. The handout is for SPSS and the US Longitudinal Study of Adolescent Health data set. For handouts on the data set code book and raw data file, a PowerPoint to accompany the handout, or questions please email kristin.flaming@gmail.com or ldierker@wesleyan.edu.This handout was developed as a condensed
Subjects:
Grades:
6th - 12th, Higher Education, Adult Education
Types:
Showing 1-24 of 30 results


