318 results
7th grade Earth Day graphing laboratories

Beaker Pong: Experimental Design and Graphing Lab, NGSS aligned
Great 1st week or 1st month STEM activity! All parts are EDITABLE and includes a graphing grid! This is a great way to introduce the "science process" (better phrase for scientific method) at the start of a semester or anytime you want fun to occur in your classroom.*****Focus on the NGSS PRACTICES Dimension*****The National Research Council's (NRC) Framework describes a vision of what it means to be proficient in science; it rests on a view of science as both a body of knowledge and an evidenc
Subjects:
Grades:
7th - 12th
Types:
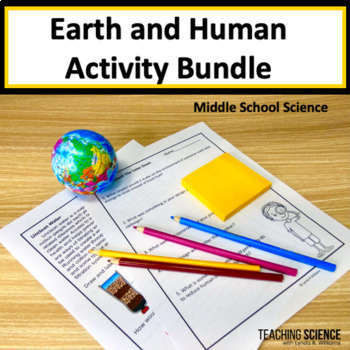
Natural Hazards & Human Impact on the Environment Science & Renewable Energy
This bundle is for the Earth and Human Activity Strand for Middle School Science. Students should understand the impacts of humans on natural resources, the impacts of natural hazards on humans, and the impacts of human activity on Earth processes. ✅ Save 20% by purchasing as a bundle! This bundle covers the standards in the Earth and Human Activity Strand as part of the Earth Science Middle School standards.☀️This Human Impact Bundle Includes:Distribution of Resources NGSS MS-ESS3-1.Natural H
Subjects:
Grades:
6th - 8th
Types:
NGSS:
MS-ESS3-2
, MS-ESS3-1
, MS-LS2-5
, MS-ESS3-5
, MS-ESS3-4
...
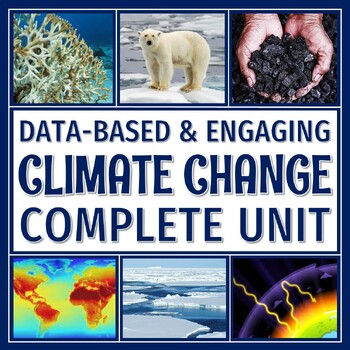
Global Warming Climate Change Unit Text Activity Quiz Test Lesson Plan Bundle
SAVE OVER 45%! This climate change unit is engaging, data-driven, and provides a large variety of activities and assessments. EVERYTHING YOU NEED TO TEACH A COMPREHENSIVE CLIMATE CHANGE UNIT IS INCLUDED. All of the work has been done for you - from start to finish! Reflect the rigor of NGSS with the included texts, engaging activities, and assessments. This unit has a little bit of everything, even a sub plan. The resources included provide numerous opportunities for data analysis and cri
Subjects:
Grades:
7th - 10th
Types:
NGSS:
MS-ESS3-5
, MS-ESS3-4
, HS-ESS3-5
, HS-ESS3-4
Middle School Scientific Method Unit - Notes, Labs, Activities, Test
This 70-page unit includes 7 lessons taking place over 4-5 weeks to teach your middle school students about the scientific method. Each lesson includes teaching notes, links to any supplemental materials (notes slideshows, videos, etc.), and student materials (notes, activities, labs, project outline, test, etc.). This includes two full labs, 3 sets of scaffolded notes, 9 classroom activities, a science fair project, and a unit test.Lesson 1 - Introduction to the Scientific Method activity - stu
Subjects:
Grades:
6th - 8th
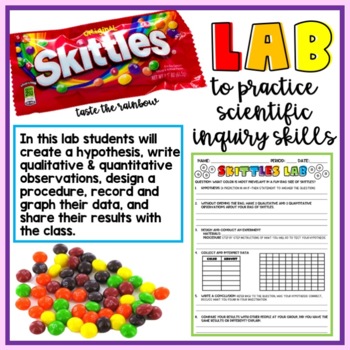
Skittles Lab: Scientific Inquiry-Scientific Method Practice
Want a fun way for students to practice scientific inquiry/ scientific method skills? This skittles lab is perfect for students practicing or reviewing how to create a hypothesis, make detailed qualitative and quantitative observations, design a step by step procedure on how to execute their experiment, graph results, and write a conclusion of their findings. There is also an opportunity to obtain class data and break down their findings by whole classes and find the percentages of what color is
Subjects:
Grades:
3rd - 8th
Types:
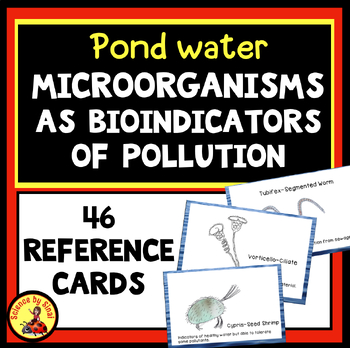
Pond Water MICROORGANISMS BIOINDICATORS of Water Pollution 46 Reference
Students observe and identify pond water microorganisms with microscopes to determine if it is polluted or not. Here are 46 reference cards of protists and invertebrates with pollutant tolerance levels indicated. Some common protists and pond organisms can be used as bioindicators. Are you studying MS-ESS3-3 or HS-ESS3-4 and discussing the impact that humans have on our waterways? For years I have taken my middle school classes to a nearby pond to collect organisms to look at under the microsc
Subjects:
Grades:
7th - 9th
Types:
NGSS:
MS-ESS3-3
, HS-ESS3-4
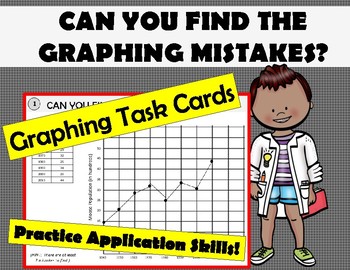
Can you find the LINE GRAPHING MISTAKES? 8 Graph Task Cards Application
Have you spent some time teaching graphing? Are students making the same mistakes over and over? Have them catch the mistakes with this task card activity.This product consists of 8 task cards; each with a set of data and a line graph that is graphed incorrectly (with at least 2 mistakes). Students need to find the mistake on each one!This can be done as a stations activity, a whole group lesson or as a pass game. As an enrichment for early finishers, included is a sheet for students to make
Subjects:
Grades:
5th - 10th
Types:
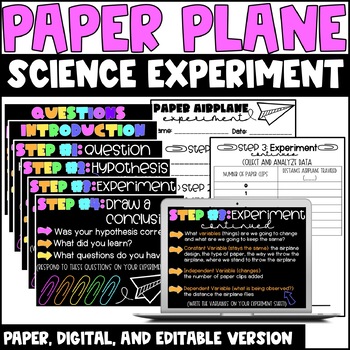
Scientific Method Paper Airplane Experiment | Digital | Editable | No Prep
Before my students delve deep into the Science curriculum, I ensure they have a clear understanding for the Scientific Method. This Paper Airplane Experiment allows children to explore the Scientific Method as they practice collecting and analyzing data from controlled, independent, and dependent variables. So...HOW DOES IT WORK? Students will fly a paper airplane and compare the distance it traveled to the distance that same paper airplane traveled when paper clips are added. PSA: the airplane
Subjects:
Grades:
3rd - 8th
Types:
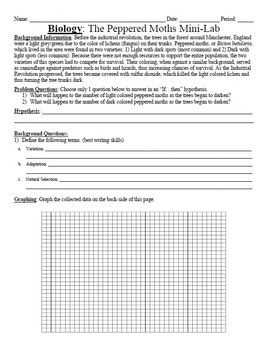
Natural Selection Peppered Moth data analysis
Students will examine data from the historical peppered moth experiment and answer several analysis questions and create a graph of the data. This is a great way to reinforce the concept of natural selection as the population sizes of two Peppered moths increase and decrease as the environment changes.Three items in this download:1) Peppered moth analysis (Word)2) Peppered moth analysis (pdf)3) Answer key for the peppered moth analysis (Word)Here are a few other Evolution-based lessons:Natural S
Subjects:
Grades:
6th - 12th
Types:
Water Bottle Flipping Investigation
Water bottle flipping- ratio, percent, measurement, data collection and graphing! The kids love bottle flipping and this product will let you bring bottle flipping into your classroom in an educational way!
Students will make predictions about the ideal water level in their water bottle that will result int he most successful flips. They will then record data about their bottle and conduct a variety of trials using different water levels to test their success with flipping their bottle at d
Subjects:
Grades:
5th - 7th
Types:
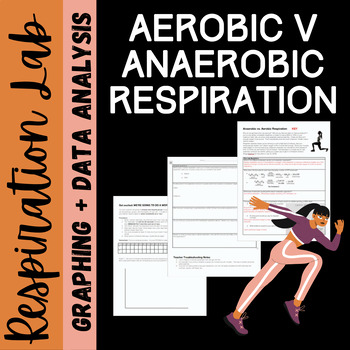
Anaerobic vs. Aerobic Respiration Lab
This lab asks students to pick a muscle group and push it to the point of anaerobic respiration. Students should have background knowledge before beginning this. This activity can be done using only a stop watch to time reps (sit-ups, push ups, etc.), but I like to borrow hand weights, yoga balls or pilates bands from the gym for extra fun. Kids really get into this activity!I have uploaded this in a .docx format, so you can edit and differentiate for your classroom and students' needs. Enjo
Grades:
7th - 12th
Types:
NGSS:
HS-LS1-7
Also included in: Photosynthesis and Respiration Bundle
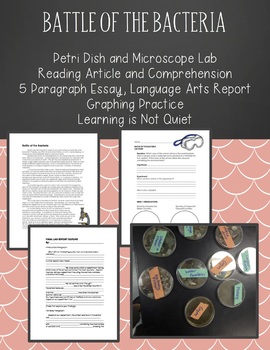
Battle of the Bacteria Cells Petri Dishes (Article, experiment, report)
Battle of the Bacteria Video / Lesson Plan Explained: https://www.youtube.com/watch?v=OAXqaKTLoRcWhether you teach upper elementary or middle school, it can be difficult to fit all of the subjects in a given day. With this activity, it makes it simple to teach math, writing, reading, health, and of course science together with one experiment. (I have done this activity as a 5th grade and 7th grade teacher).In this activity, students go throughout the school and collect samples of places that t
Subjects:
Grades:
5th - 7th
Types:
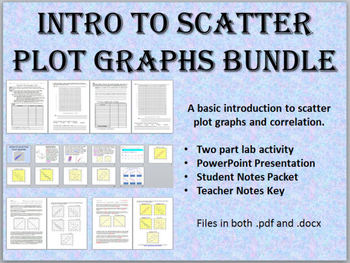
Introduction to Scatter Plot Graphs Bundle - Lab, Notes, PowerPoint Presentation
This Intro To Scatter Plot Graphs bundle contains:
• Intro to Scatter Plot Notes (2-page fill-in style student version and 2-page teacher version)
• PowerPoint Presentation (11 slides)
• Scatter Plot Lab Activity (4 pages)
• Files in both .pdf and .docx. PowerPoint is .ppt
This bundle contains a basic introduction to scatter plot graphs and correlation (perfect positive, perfect negative, high positive, low positive, high negative, low negative, and no correlation). Also includes a link to pra
Grades:
7th - 10th
Types:
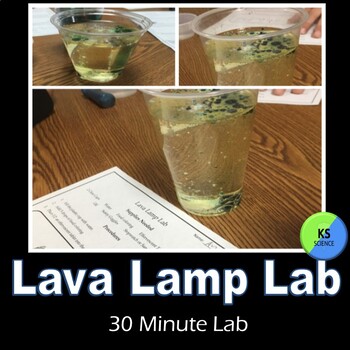
Lava Lamp | Oil And Water Science Experiment | Matter And Its Interactions
Use effervescent tablets to create lots of oohs and ahhs while discovering the properties of oil and water. This hands-on lab can be conducted in 30 minutes. It uses simple supplies and includes teacher background information, tips, science activity, and a reading passage. It makes an excellent introductory lesson about oil spills for environmental science and Earth Day.Included in the Hands-on ActivityBackground Information and Vocabulary on the Properties of Miscible and Immiscible Liquids.Han
Subjects:
Grades:
4th - 7th
Types:
NGSS:
5-PS1-3
, 5-PS1-4
, MS-PS1-2
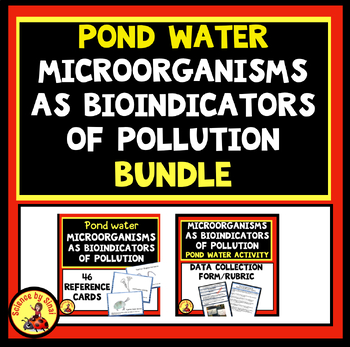
Microorganisms as BIOINDICATORS OF WATER POLLUTION In a Pond Activity BUNDLE
Here is a set of 46 bioindicator microorganism identification cards for students to use as they search for creatures using microscopes looking at pond water. Also included is a data collection form and a final project rubric. Please see the descriptions and previews of each of the two products.
Subjects:
Grades:
6th - 9th
Types:
NGSS:
MS-ESS3-3
, HS-ESS3-4
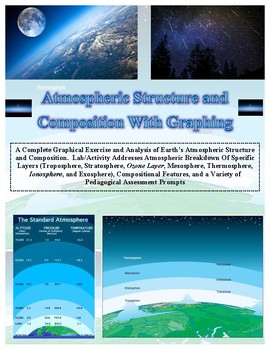
Atmospheric Layers Structure and Graphing LAB (An Earth Science Favorite!)
PROCEEDS BENEFIT "REACH INC."-EMPOWERING ADULTS WITH DISABILITIES
http://www.reachinc.org
Great COMBINATION of both math and science! This is an updated version by Southern Science Specialists.
New content, assessment prompts, and graphical template.
---------------------------------------------------------------------------------------------------------
See the "Extended Version" that additionally addresses the atmospheres of other planets found at the link below
CLICK HERE FOR EXTENDED VER
Subjects:
Grades:
5th - 10th, Adult Education
Types:
Scientific Method NGSS Crosscutting Concepts Activity & PowerPoint
Students will have a great time learning about science skills, experimental design, NGSS Cross Cutting Concepts, and NGSS Science and Engineering Processes with this resource! And it's Google Ready! It's packed with teacher notes to make your job easy!All you need are two tennis balls per group, one meter stick per group and something to keep the tennis balls cold like a cooler or freezer. The data really shows the difference between the bounce of a cold tennis ball and a room temperature ball.
Subjects:
Grades:
5th - 12th
Types:
Graphing Activity: Historic CO2 Levels (Paleoclimate)
A great activity for Earth Day in the middle school, or for teaching climate change in an Earth Science class!----------------------------------------------------Middle school students often know that CO2 levels on earth are rising, and that there is a lot of concern about how the climate will change as a result of this increase.However, most students are not aware of the historic and cyclical changes of CO2 here on Earth that affect history climates, often referred to a Paleoclimate.-----------
Subjects:
Grades:
6th - 9th
Types:
Analyzing Data Interactive Notebook Pages & PowerPoint for the Scientific Method
This middle school science resource has two interactive notebook pages and a 29 slide PowerPoint about analyzing data and making good graphs in the scientific method. The INB pages and PowerPoint emphasize these important graphing concepts:a title that's a combination of the independent and dependent variablesan x-axis label that contains the independent variablea y-axis label that contains the dependent variableaccurate intervals on graphsthe purposes and uses of bar graphs, line graphs, and pi
Subjects:
Grades:
5th - 8th
NGSS:
MS-ETS1-3
Also included in: Scientific Method Interactive Notebook Pages and PowerPoint BUNDLE
MS-PS4-1 Mathematical Models of Waves Lab | Printable, Digital & Editable
About SNAPs Lab Stations ActivitiesSNAPs Lab Stations Activities require students to use science, math, literacy, problem-solving and engineering skills. They are designed to enhance students' understanding of scientific concepts and help students apply scientific ideas to the real world. Each station activity promotes skills so to develop students into proficient and competent scientific thinkers.SNAPs lab activities have five components:• Science Skills Station to develop science skill profici
Subjects:
Grades:
5th - 9th
Types:
NGSS:
MS-PS4-1
Also included in: Physical Science Lab Stations Bundle | Printable, Digital & Editable
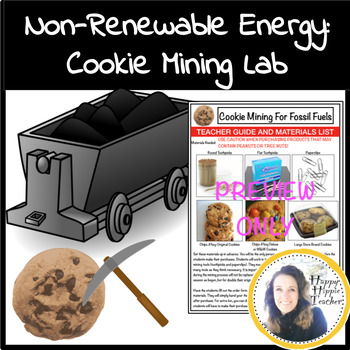
Nonrenewable Energy Resources - Cookie Mining Activity
THIS RESOURCE IS PART OF MY EARTH BUNDLE FOR A BIG DISCOUNT! Give your students a hands on and authentic learning experience as you study the processes behind obtaining fossil fuels. This cookie mining lab provokes students to strategize, work collaboratively, and gain understanding on the difficulties with mining nonrenewables for energy resources. ~~~~~~~~~~~~~~~~~~~~~~~~~~~~~~~~~~~~~~~~~~~~~~~~~~~~~~~~~~~~~~~~~~~~~~~~~~~~~~~~~~~~~~~~~~Students will have a change to analyze and interpret seve
Subjects:
Grades:
4th - 12th, Higher Education, Adult Education
Types:
Also included in: Environmental Science Bundle - Repurposing Project and Lab Activities
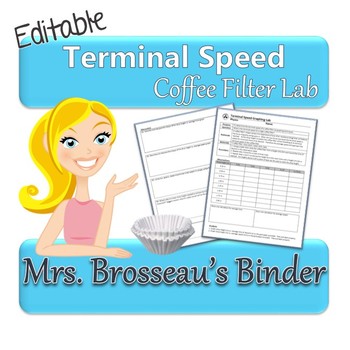
Terminal Speed Physics Lab & Graphing Activity using Coffee Filters {EDITABLE}
Do you want a teach your students about terminal speed, but can't find the time to put together a complex lab and then mark it all?
This is the lab for you!
This is part of my cost-saving, amazing Physics Bundle!
This is a quick lab that your students can complete start to finish in one class period. The student handout pages include:
• Purpose
• Question
• Rationale
• Materials
• Procedure
• Observation Table
• Graphing and Follow-up Questions + Conclusion
You'll need:
• meter stick
• coff
Grades:
7th - 12th
Types:
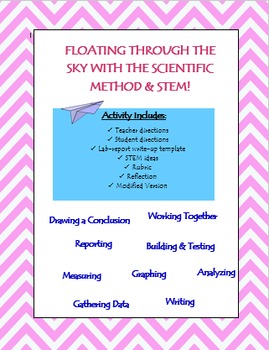
Paper Airplane Scientific Method Lab Report Write-Up with STEM Component
This is a summative assessment that assesses the scientific method and the process of writing up a lab report using paper airplanes. This assessment can also be easily differentiated based on the level of your students. This activity allows for independent work and accountability, partner or small group collaboration, and whole class data sharing so everyone is involved.
This file includes the following:
--Student directions
--Teacher directions
--Rough draft template for the lab report-wri
Subjects:
Grades:
6th - 10th
Types:
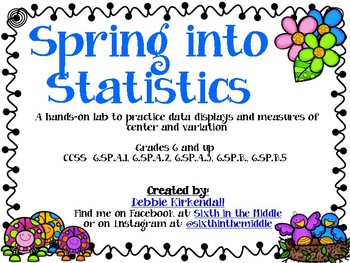
Spring into Statistics Data Displays and Measures of Center Lab
This is a hands-on lab that teaches about Statistical Questions, Data Displays (dot/line plot, histograms, box plots) and Measures of Center (mean, median, mode, and range). The lab includes notes pages, examples with answer keys, and a final project in which the student can survey classmates and create a "flower" by using their data to find mean, median, mode, range. They will also create a box plot, histogram and dot plot.
Showing 1-24 of 318 results


