4,882 results
Statistics internet activity microsofts
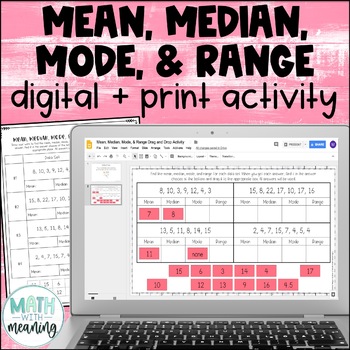
Mean, Median, Mode, & Range Digital and Print Activity for Google Drive
Looking for a fun, no-prep activity for finding mean, median, mode, and range? Students will find the mean, median, mode, and range for 4 data sets. They will then then find their answer from the answer choices at the bottom and drag it to the appropriate spot. Each data set contains 6-8 numbers. Please view the preview file to make sure that this activity is appropriate for your students.This product includes the following:A link to the digital activity on Google Slides including student direct
Subjects:
Grades:
5th - 8th
CCSS:
Also included in: Middle School Math Digital and Print Activity Bundle Volume 1
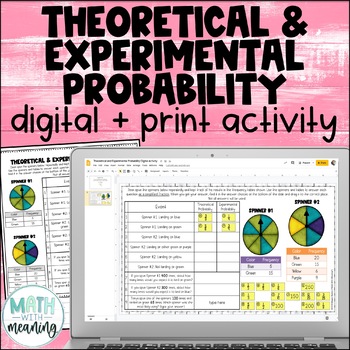
Theoretical and Experimental Probability Digital and Print Activity
Looking for an engaging, no-prep activity to practice working with theoretical and experimental probability? Students will use two sets of spinners and frequency tables to answer questions in this fun digital and print activity.This activity requires students to find the theoretical and experimental probabilities of simple events and to use theoretical probabilities to make predictions. Please view the preview file to make sure that this activity is appropriate for your students.This product inc
Subjects:
Grades:
5th - 8th
CCSS:
Also included in: Middle School Math Digital and Print Activity Bundle Volume 3
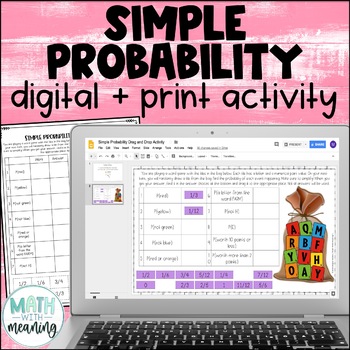
Simple Probability Digital and Print Drag and Drop Activity for Google
Looking for an engaging, no-prep activity to practice finding the probability of simple events? Students will use the included image to find the probability of 10 simple events. They will then find their answer from the answer choices at the bottom and drag it to the appropriate spot. Please view the preview file to make sure that this activity is appropriate for your students.This product includes the following:A link to the digital activity on Google Slides including student directionsA PowerP
Subjects:
Grades:
5th - 8th
CCSS:
Also included in: Middle School Math Digital and Print Activity Bundle Volume 1
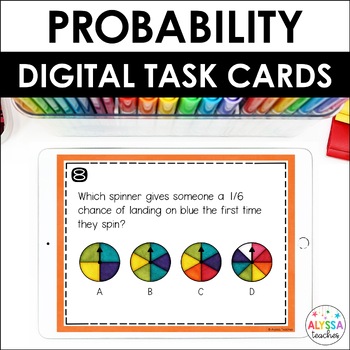
Probability Task Cards (Digital)
Probability is one of my favorite math topics to teach! These digital probability task cards make a great review activity for math centers, warmups, early finishers, and more. You can use this set during your probability unit or save it for an end-of-year test review.To complete the task cards, students move objects on the screen and type answers to questions. They'll complete everything directly in Google Slides. No prep for you; no lost papers for them!Students will:use probability vocabulary
Subjects:
Grades:
4th - 5th
Types:
CCSS:
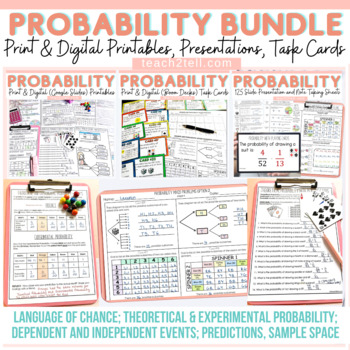
Chance and Probability Activities Theoretical & Experimental Probability Bundle
Are you teaching your students all about chance and probability and looking for fun hands-on probability activities? This print and digital bundle of worksheets, task cards, slideshows and note-taking sheets on Probability will reinforce the understanding of theoretical probability, experimental probability, language of chance, sample space, predictions, lists, tree diagrams, dependent probability events and independent probability events.Both US and British English spelling and terminology file
Subjects:
Grades:
4th - 7th
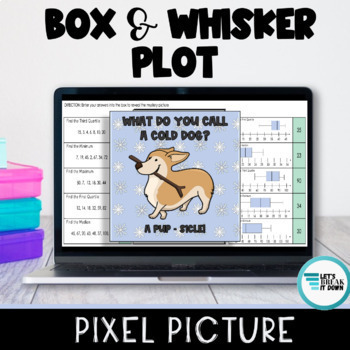
Box and Whisker Plots Puzzle Digital Pixel Art Activity | Distance Learning
Students will find the minimum, median, maximum, first and third quartile from each given set of numbers and interpret box plots. This Google Sheet(TM) activity is no prep, can be assigned in seconds on Google Classroom, and is a breeze to grade. Students will be amazed as more of the picture reveals with each correct answer. Students will have fun while getting immediate feedback on their understanding! Every time they enter a correct answer more of the picture will be revealed and the cell wil
Subjects:
Grades:
6th - 7th
Types:
CCSS:
Also included in: 6th Grade Math Picture Pixel Art Digital Activities Google Classroom
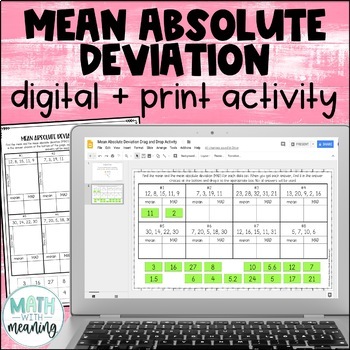
Mean Absolute Deviation MAD Digital and Print Activity for Google Drive
Looking for an engaging, no-prep activity to practice finding the MAD? Students will find the mean and mean absolute deviation for 8 data sets. They will then then find their answer from the answer choices at the bottom and drag it to the appropriate spot. Each data set contains 4-5 numbers. The mean of each data set is a whole number. Please view the preview file to make sure that these types of problems are appropriate for your students.This product includes the following:A link to the activit
Subjects:
Grades:
6th - 9th
CCSS:
Also included in: Middle School Math Digital and Print Activity Bundle Volume 2
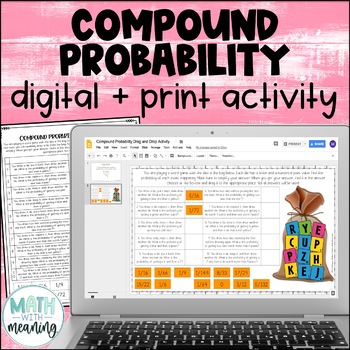
Compound Probability Digital and Print Activity for Google Drive and OneDrive
Looking for an engaging, no-prep activity to practice finding the probability of compound events? Students will use the included image to find the probability of 10 compound events, including both independent and dependent events. They will then find their answer from the answer choices at the bottom and drag it to the appropriate spot. Please view the preview file to make sure that this activity is appropriate for your students.This product includes the following:A link to the digital activity
Subjects:
Grades:
6th - 9th
CCSS:
Also included in: Middle School Math Digital and Print Activity Bundle Volume 1
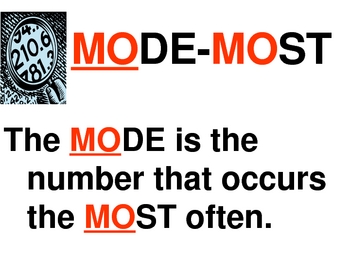
Statistics Mean, Median, Mode & Range Interactive PowerPoint by Erica
Introduce statistics including mean, median, mode and range with this colorful, interactive 22 slide PowerPoint. This interactive PowerPoint introduces each term and teaches a strategy for finding the value. There is also a trick or visual to help students remember the steps to find each one (mean, median, mode and range). Students are able to practice finding the mean, median, mode and range and then check within the PowerPoint. This is excellent for a statistics lesson or for students to e
Subjects:
Grades:
3rd - 6th
Math March Madness Full Tournament Project {BUNDLE}
Harness the excitement of NCAA March Madness with this huge project for secondary math teachers that follows all stages of the tournament! This Common Core aligned bundle comes with bonus parts not sold individually in my store so you can create a rich immersion in the tournament, practice probability and statistics and learn some interesting new ones along the way! Save $3 plus get bonus content by bundling!You can pick and choose which parts you would like to incorporate, or follow my schedu
Subjects:
Grades:
6th - 12th, Higher Education
Types:
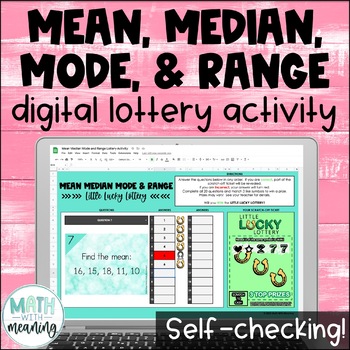
Mean Median Mode and Range Self-Checking Digital Activity - Measures of Center
Looking for a fun self-checking activity to practice finding mean, median, mode, and range? Students will solve 20 problems in this engaging, no-prep digital lottery activity!Each data set includes 4-8 numbers. The answer to each problem is a whole number. There are problems where there is no mode. Please look at the preview file to see if these types of problems are appropriate for your students.In this activity, students will answer questions in order to scratch off their digital lottery ticke
Subjects:
Grades:
5th - 8th
Types:
CCSS:
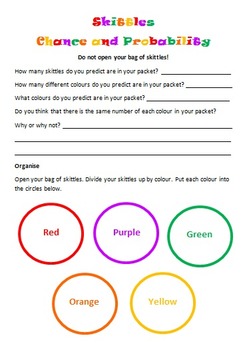
Skittles Chance and Probability (Editable)
Chance and Probability activity using yummy Skittles!!!
Students are to predict the colours and quantities before they open the skittles bag. Students are to complete a chance experiment where they use a tally to collect their data. Students then transfer their data in fractions, decimals and percentages. Students are to create a bar graph using their data as well as answer chance and probability questions about the data. I used this with my grade 5/6 students and they loved it!
Subjects:
Grades:
3rd - 10th
Types:
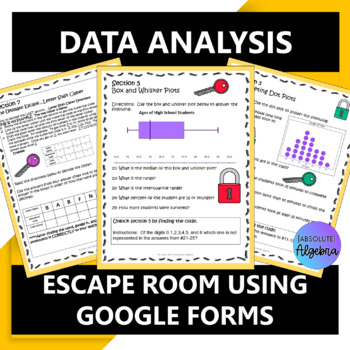
Data Analysis Digital Digital Escape Room using Google Forms
#overtherainbow Data Analysis Digital Escape Room Google FormsGive your students comprehensive practice on data analysis including variability, mean, median, mode, range, IQR, box and whisker, dot, stem and leaf plots, histograms, relative frequency tables, and more! This is a NO PREP Escape Room using technology! Just hand your students the worksheet, give them URL for the google form and they're ready to go!This resource includes:VariabilityMean, Median, Mode, Range, and Interquartile Range (I
Subjects:
Grades:
6th - 7th
Types:
Also included in: Middle School Math Activities Bundle
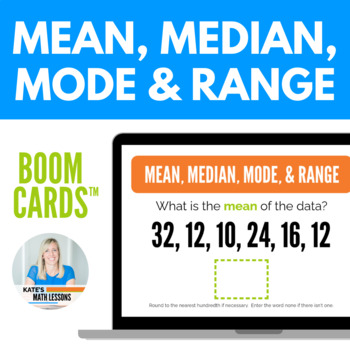
Mean, Median, Mode, & Range Digital Activity Boom Cards™
Working on mean, median, mode, and range? This set of 34 digital task cards is a great way to help students practice finding measures of central tendency: mean, median, mode, and range of a data set (MMMR). Students are shown one question at a time and get instant feedback! The first few cards help students review the meaning of each term before finding the measures of central tendency. Data sets are given as lists of numbers, in tables, or in word problems (you can hide any cards you don't
Subjects:
Grades:
5th - 7th
Types:
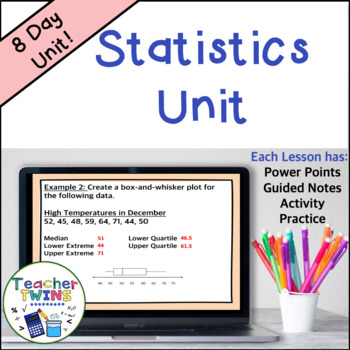
Statistics Unit - Mean Absolute Deviation - Populations and Samples - Box Plots
Make lesson planning easy with this no-prep Statistics - Mean Absolute Deviation - Populations and Samples - Box-and-Whisker Plots Unit! Included are 8 ready-made lessons to teach finding mean absolute deviation as well as interpreting and creating box-and-whisker plots. This unit is very easy to use and will save you a lot of time! Your students will learn how to find mean absolute deviation and interpret box-and-whisker plots by using our editable PowerPoints with guided notes. Students will l
Subjects:
Grades:
6th - 8th
Also included in: 7th Grade Math Curriculum Bundle
Statistics Project - Statistics Olympics
Engage your students in their study of statistics as they compete in self-created Olympic style events. This project will engage students and help them discover meaning and apply concepts including measures of central tendency, quartiles, outliers, variance, standard deviation, z-scores, box plots, histograms, normal and skewed distributions. This project can be completed in approximately 6-8 days (50-min class periods) ** March 2023 Update **Visual updates to all slides and documentsRubric ali
Subjects:
Grades:
6th - 12th
CCSS:
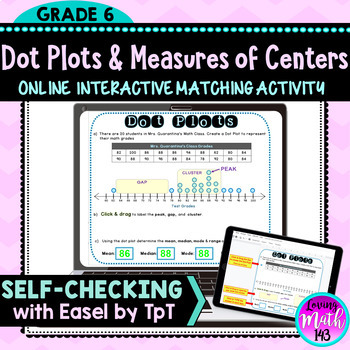
Dot Plots and Measures of Center Digital Activity for Distance Learning
Dot Plots & Measures of Center Interactive Activity for Distance LearningStudents will create a Dot Plot / Line Plot for a data set with 20 values. Students will identify the cluster, peak, and gap located on the Dot Plot. Students will also find the mean, median, mode, and range for the data set. it is a perfect resource for distance learning and students using Google Classroom™. This activity is interactive. Students will click and drag to move the dots to create the dot plot. In addition
Subjects:
Grades:
6th
Types:
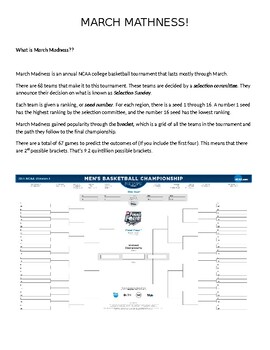
2024 March Mathness Madness NCAA Basketball Probability and Statistics Lesson
Every year I get my students excited about the NCAA Men's Basketball March Madness Tournament. I see articles written year after year from statisticians, sports journalist, celebrities, etc. about predicting the perfect bracket. Regardless that most have accepted it is nearly impossible, it has not deterred these enthusiast from finding an algorithm or a machine that can predict the outcomes.This packet guides students through 1) An explanation of what March Madness is all about2) A reading abou
Subjects:
Grades:
4th - 12th
Types:
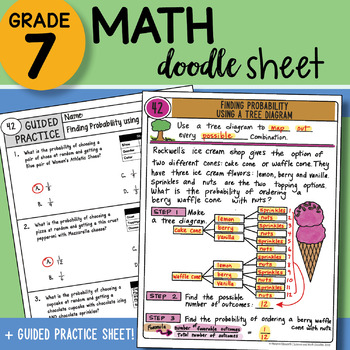
Math Doodle - Finding Probability using a Tree Diagram - Easy to Use Notes w PPT
7th Grade Math Doodle Sheet Product INCLUDES:Math Doodle Sheet - blank and keyGuided Practice Sheet - blank and keyPowerPoint – to show students the KEY– two versions of both sheets included: INB and large 8.5 x 11 size ALL TEKS Aligned– plan for the FULL year included with table of contents page for INB! SAVE BIG and buy the WHOLE YEAR SET found here:7th Grade Math Doodle Sheets ALL YEAR SET WHOLE YEAR SET List below:ALL TEKS Aligned– plan for the FULL year included! LIST of 88 Doodle Sheets p
Subjects:
Grades:
6th - 8th
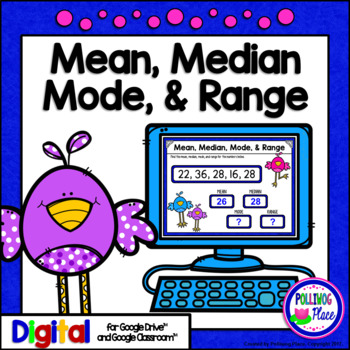
Mean Median Mode and Range - Statistics for Google Drive and Google Classroom
This Mean, Median, Mode, and Range data and statistics activity is designed for the interactive digital classroom using Google Drive (TM). Your students will practice finding the mean, median, mode, and range for sets of numbers.This activity set includes: * 20 slides for finding the mean, median, mode, and range * Student instruction slide * Getting started guide for teachers * Answer KeyThis is a low-prep activity that works with Google Drive (TM) and Google Classroom (TM). You wi
Subjects:
Grades:
4th - 6th
Types:
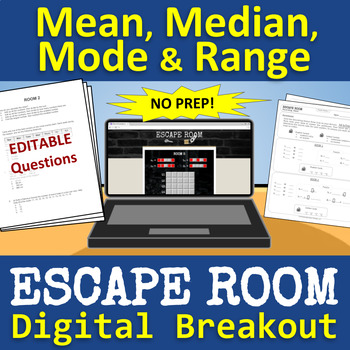
Mean, Median, Mode & Range ESCAPE ROOM - Digital Breakout | Distance Learning
Students will have a blast trying to break out of this escape room! There are 5 digital rooms with fun puzzles that engage students and challenge their problem-solving skills while they practice math content (mean, median, mode and range). Great for team-building! Quick and easy setup. Includes 100% digital option! CLASSROOM SETUP:Print/copy the math questions for each group.Print/copy the recording sheet for each student.Provide a device for each group (the Escape Room link is on the recording
Subjects:
Grades:
6th - 8th
Also included in: Math Escape Room - Digital Breakout - BUNDLE
Mean, Median, Mode, and Range (Bundled Unit) - Distance Learning
This is an enjoyable, interactive, and engaging bundled unit covering mean, median, mode, and range (and introduces outliers). This unit is great for 5th and 6th graders and 7th graders who struggle with these concepts.Included in this bundled unit:PowerPointAnimated and fun 4-part, 21-slide PowerPoint (multi-day use)-Part 1 – The Meaning of Mean-Part 2 – Getting in the Middle of Median-Part 3 – Making the Most of Mode-Part 4 – Home, Home on the RangeEach section offers plenty of practice probl
Subjects:
Grades:
5th - 7th
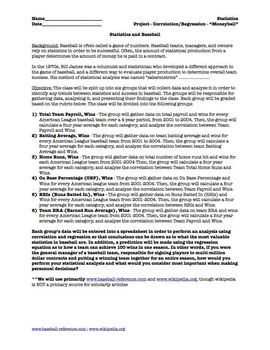
Statistics Correlation and Regression Project for Movie "Moneyball" (5 day)
Prerequisite: Correlation and Regression (Linear). This is a project that divides a statistics class into 6 groups and students do ACTUAL data collection from given websites and they perform their OWN ANALYSIS. They will use computers/internet/excel/spreadsheets/graphing calculators to evaluate correlation. If you have interest in baseball and statistics, this is a great project to get the class interested, and covers about 5 days, plus you can watch the movie "Moneyball" afterwards as a reward.
Subjects:
Grades:
10th - 12th, Higher Education, Adult Education
Types:
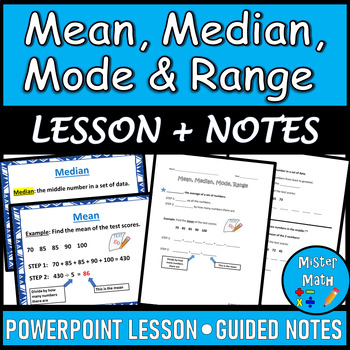
Mean, Median, Mode & Range PPT and Guided Notes BUNDLE
This Mean, Median, Mode & Range BUNDLE includes a PowerPoint Lesson and a corresponding Guided Notes Packet to assist students in learning about finding the mean, median, mode, and range of data sets. The PowerPoint and Guided Notes packet include key vocabulary, as well as an example for each skill. Additional practice problems are included that ask students to find the mean, median, mode and range of four data sets (for a total of 16 extra practice problems!) The presentation also comes fu
Subjects:
Grades:
3rd - 6th
Showing 1-24 of 4,882 results


