1,378 results
Statistics internet activities for Easel Activities
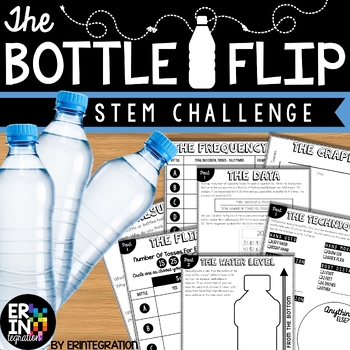
Water Bottle Flip STEM Challenge + STEM Activity
The ORIGINAL water bottle flip STEM activity and lab! Water bottle flip at school? Absolutely! Students will love this on-trend STEM challenge inspired by the popular YouTube water bottle flipping challenge where students toss a water bottle and attempt to land it straight up. Practice scientific method with some probability, fractions and data collection in the mix while having fun!This self-paced, low-prep, project based learning water bottle flip STEM challenge is print-and-go. Each activit
Subjects:
Grades:
3rd - 6th
Types:
CCSS:
NGSS:
K-2-ETS1-2
, K-2-ETS1-3
, MS-ETS1-2
, K-2-ETS1-1
, 3-5-ETS1-3
...
Two Way Relative Frequency Tables Worksheet
Are you a math teacher looking for engaging classwork or homework activities to help your students with relative frequency tables? Look no further! Our worksheet on completing two-way tables and creating relative frequency tables is perfect for your needs. Great for Pre-Algebra and Algebra 1 students. With real-world situations and comprehension questions based on relative frequency tables, students will learn to summarize and interpret data collected from the same subjects. They'll construct an
Subjects:
Grades:
8th - 9th
Types:
CCSS:
Also included in: Scatterplots Two Way Tables and Residual Plots Worksheets Bundle
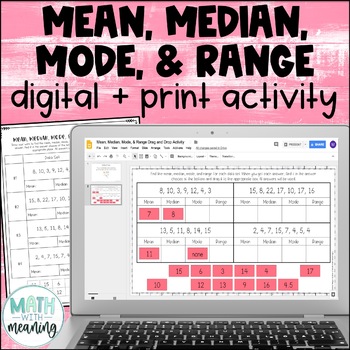
Mean, Median, Mode, & Range Digital and Print Activity for Google Drive
Looking for a fun, no-prep activity for finding mean, median, mode, and range? Students will find the mean, median, mode, and range for 4 data sets. They will then then find their answer from the answer choices at the bottom and drag it to the appropriate spot. Each data set contains 6-8 numbers. Please view the preview file to make sure that this activity is appropriate for your students.This product includes the following:A link to the digital activity on Google Slides including student direct
Subjects:
Grades:
5th - 8th
CCSS:
Also included in: Middle School Math Digital and Print Activity Bundle Volume 1
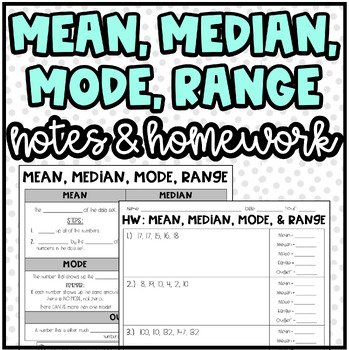
Mean, Median, Mode, Range, and Outlier | Notes and Homework or Practice
Notes & Homework: Mean, Median, Mode, Range, and Outlier:I used these notes, practice, and homework with my students. I used this lesson to serve as a "quick lesson" for the students. It covers how to find the mean, median, mode, range, and outlier.Product Includes:Notes Page with 2 examplesNotes Page Answer KeyHomework (10 organized problems with workspace provided)Homework Answer KeyThank You! ❤️I really appreciate your interest in my product! I love to create new things for my students! A
Subjects:
Grades:
5th - 8th
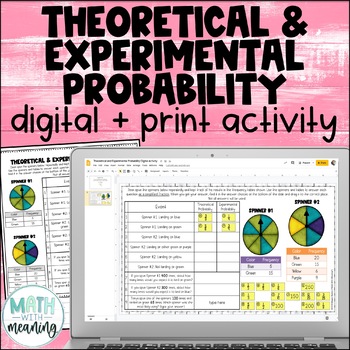
Theoretical and Experimental Probability Digital and Print Activity
Looking for an engaging, no-prep activity to practice working with theoretical and experimental probability? Students will use two sets of spinners and frequency tables to answer questions in this fun digital and print activity.This activity requires students to find the theoretical and experimental probabilities of simple events and to use theoretical probabilities to make predictions. Please view the preview file to make sure that this activity is appropriate for your students.This product inc
Subjects:
Grades:
5th - 8th
CCSS:
Also included in: Middle School Math Digital and Print Activity Bundle Volume 3
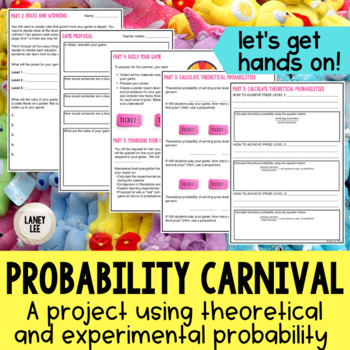
Probability Carnival Game Project - PDF & Digital
Looking for a fun, hands on way to bring probability to life? Are you ready to move past the "sit and get" style of whole group instruction? If you answered yes to either of those questions, then this resource is for you!Keep your students engaged and accountable with the interactive, versatile Probability Carnival! The steps of this project are designed to be rigorous and require students to predict, reflect, connect, and think critically about the situations being investigated.Using this proje
Subjects:
Grades:
6th - 8th
Types:
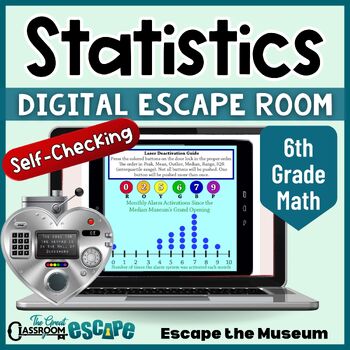
6th Grade Math Data Analysis & Statistics Activity Digital Escape Room Game
Find the median, read the box plot, interpret the frequency table, and unlock the door! This 6th grade math activity based on statistics and probability standards will put your students statistical skills to the test. Your students are volunteer docents at the Median Museum. After the security system locks everyone in, they will need to use their knowledge of statistics to escape the museum. This engaging digital escape room is easy for teachers to implement. The breakout process is fully autom
Subjects:
Grades:
6th - 7th
Types:
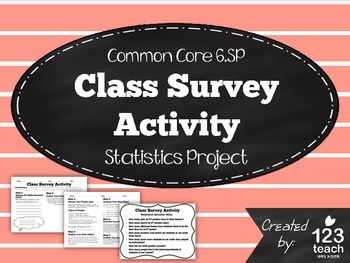
Class Survey Activity - Common Core 6th Grade Statistics Project
This "Class Survey Activity" includes a two page activity aligned to common core standards for statistics and probability (6.SP).
Students will have to come up with a statistical question to survey their classmates. Then, the students will record their results, create a graph, and analyze their data. Lastly, the students will present their results with the class. With my class, I give the students at least a full class period to complete the activity, and then it takes another class perio
Subjects:
Grades:
5th - 7th
Types:
Also included in: Math Assessments and Review Activities BUNDLE for 6th Grade Common Core
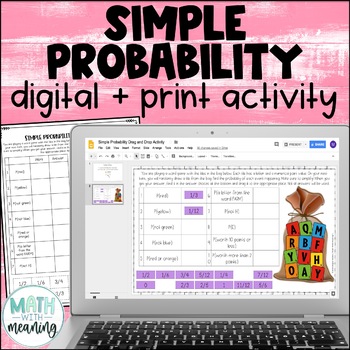
Simple Probability Digital and Print Drag and Drop Activity for Google
Looking for an engaging, no-prep activity to practice finding the probability of simple events? Students will use the included image to find the probability of 10 simple events. They will then find their answer from the answer choices at the bottom and drag it to the appropriate spot. Please view the preview file to make sure that this activity is appropriate for your students.This product includes the following:A link to the digital activity on Google Slides including student directionsA PowerP
Subjects:
Grades:
5th - 8th
CCSS:
Also included in: Middle School Math Digital and Print Activity Bundle Volume 1
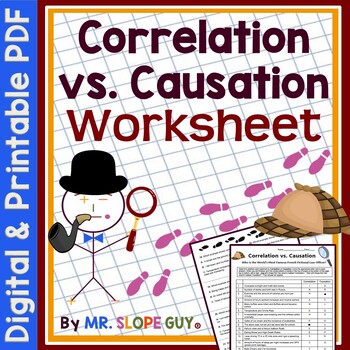
Correlation vs Causation Worksheet
Hello Math Teachers! Help your math students understand the difference between correlation and causation with our fun activity worksheet. Students will evaluate 42 statements and determine whether they demonstrate correlation or causation, and there are some multiple-choice questions as well. This activity also includes a puzzle that generates an answer, making it easy to grade.This two-sided worksheet is great for classwork or homework and is designed to help students develop critical thinking
Subjects:
Grades:
9th
Types:
CCSS:
Also included in: Algebra Math Riddle Worksheets
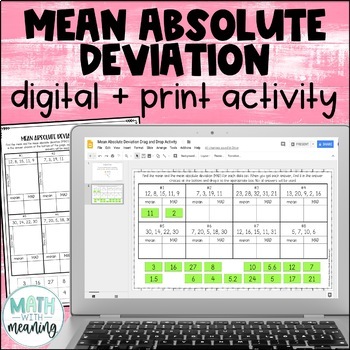
Mean Absolute Deviation MAD Digital and Print Activity for Google Drive
Looking for an engaging, no-prep activity to practice finding the MAD? Students will find the mean and mean absolute deviation for 8 data sets. They will then then find their answer from the answer choices at the bottom and drag it to the appropriate spot. Each data set contains 4-5 numbers. The mean of each data set is a whole number. Please view the preview file to make sure that these types of problems are appropriate for your students.This product includes the following:A link to the activit
Subjects:
Grades:
6th - 9th
CCSS:
Also included in: Middle School Math Digital and Print Activity Bundle Volume 2
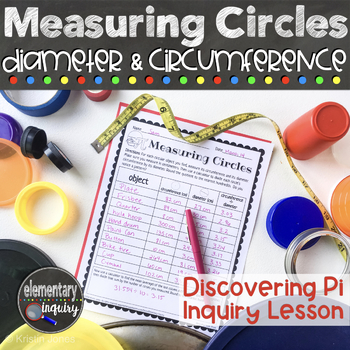
Measuring Circle Circumference & Diameter to Discover Pi - Pi Day Inquiry Lesson
Have fun finding Pi by measuring the circumference and diameter of circles of all sizes! Students will calculate the ratio of the length of a circle’s diameter to its circumference. They’ll discover that the circumference is always a little more than three times as long as the diameter. This full lesson plan and teacher script will help you lead an inquiry based investigation and class discussion. It’s perfect for an introduction to these geometry concepts, or for a fun Pi Day activity.A full, f
Subjects:
Grades:
5th - 7th
Types:
CCSS:
Also included in: Pi Day Activities - Measuring Circles Diameter, Circumference, and Area
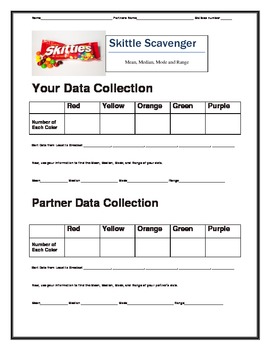
Skittles Candy with Mean, Median, Mode, Range, and Box and Whiskers Plot
This is a quick, fun activity to use with statistics. I have the kids bring in a pack of skittles and sort by color. Then all of the kids will find the Mean, Median, Mode, Range, and Box and Whiskers.
Subjects:
Grades:
4th - 8th
Types:
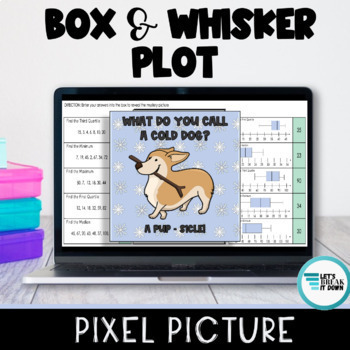
Box and Whisker Plots Puzzle Digital Pixel Art Activity | Distance Learning
Students will find the minimum, median, maximum, first and third quartile from each given set of numbers and interpret box plots. This Google Sheet(TM) activity is no prep, can be assigned in seconds on Google Classroom, and is a breeze to grade. Students will be amazed as more of the picture reveals with each correct answer. Students will have fun while getting immediate feedback on their understanding! Every time they enter a correct answer more of the picture will be revealed and the cell wil
Subjects:
Grades:
6th - 7th
Types:
CCSS:
Also included in: 6th Grade Math Picture Pixel Art Digital Activities Google Classroom
Mean, Median, Mode, & Range Digital Activity Boom Cards™
Working on mean, median, mode, and range? This set of 34 digital task cards is a great way to help students practice finding measures of central tendency: mean, median, mode, and range of a data set (MMMR). Students are shown one question at a time and get instant feedback! The first few cards help students review the meaning of each term before finding the measures of central tendency. Data sets are given as lists of numbers, in tables, or in word problems (you can hide any cards you don't
Subjects:
Grades:
5th - 7th
Types:
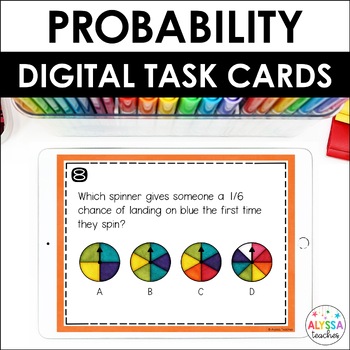
Probability Task Cards (Digital)
Probability is one of my favorite math topics to teach! These digital probability task cards make a great review activity for math centers, warmups, early finishers, and more. You can use this set during your probability unit or save it for an end-of-year test review.To complete the task cards, students move objects on the screen and type answers to questions. They'll complete everything directly in Google Slides. No prep for you; no lost papers for them!Students will:use probability vocabulary
Subjects:
Grades:
4th - 5th
Types:
CCSS:
Estimating Correlation Coefficient with Scatter Plots Worksheet
Attention Math Teachers! Are you looking for a way to help your students master estimating correlation? Look no further! Our engaging worksheet is designed to match scatter plots with the correct correlation coefficient. With a variety of reasonable choices, students will estimate the correct r value and interpret positive and negative slope, as well as the strength or weakness of the correlation coefficient of a linear fit.This two-sided worksheet comes with an easy-to-use key and is perfect fo
Subjects:
Grades:
9th
Types:
CCSS:
Also included in: Data and Statistics Worksheets Bundle
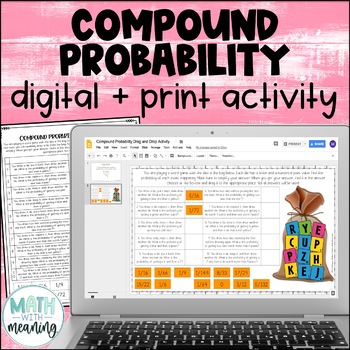
Compound Probability Digital and Print Activity for Google Drive and OneDrive
Looking for an engaging, no-prep activity to practice finding the probability of compound events? Students will use the included image to find the probability of 10 compound events, including both independent and dependent events. They will then find their answer from the answer choices at the bottom and drag it to the appropriate spot. Please view the preview file to make sure that this activity is appropriate for your students.This product includes the following:A link to the digital activity
Subjects:
Grades:
6th - 9th
CCSS:
Also included in: Middle School Math Digital and Print Activity Bundle Volume 1
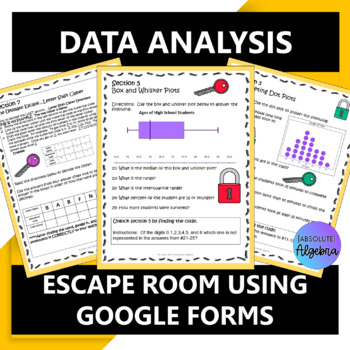
Data Analysis Digital Digital Escape Room using Google Forms
#overtherainbow Data Analysis Digital Escape Room Google FormsGive your students comprehensive practice on data analysis including variability, mean, median, mode, range, IQR, box and whisker, dot, stem and leaf plots, histograms, relative frequency tables, and more! This is a NO PREP Escape Room using technology! Just hand your students the worksheet, give them URL for the google form and they're ready to go!This resource includes:VariabilityMean, Median, Mode, Range, and Interquartile Range (I
Subjects:
Grades:
6th - 7th
Types:
Also included in: Middle School Math Activities Bundle
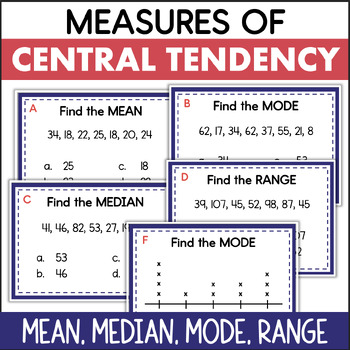
Mean Median Mode Range Measures of Central Tendency Data Task Cards
These data task cards are a great way for students to practice analyzing data to find the mean, median, mode, and range!There are several types of questions, all addressing measures of central tendency. Some require students to interpret a data set of whole numbers. Others involve data presented in a line plot. The last type of question requires the student to choose the correct method for finding the mean, median, mode, or range.This math resource includes:16 task cardsrecording sheetanswer key
Subjects:
Grades:
5th - 7th
Types:
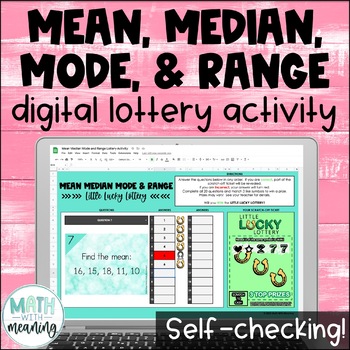
Mean Median Mode and Range Self-Checking Digital Activity - Measures of Center
Looking for a fun self-checking activity to practice finding mean, median, mode, and range? Students will solve 20 problems in this engaging, no-prep digital lottery activity!Each data set includes 4-8 numbers. The answer to each problem is a whole number. There are problems where there is no mode. Please look at the preview file to see if these types of problems are appropriate for your students.In this activity, students will answer questions in order to scratch off their digital lottery ticke
Subjects:
Grades:
5th - 8th
Types:
CCSS:
Two Way Tables Worksheet
Attention Math Teachers! Download this two-sided worksheet on completing two-way tables and analyzing bivariate data today! This worksheet is perfect for Pre-Algebra and Algebra 1 students as a classwork or homework activity.By completing this worksheet, students will check their understanding of how patterns in bivariate data can be seen by displaying frequencies and relative frequencies in a two-way table. They will also learn how to construct and interpret two-way tables, summarizing and inte
Subjects:
Grades:
8th - 9th
Types:
CCSS:
Also included in: Scatterplots Two Way Tables and Residual Plots Worksheets Bundle
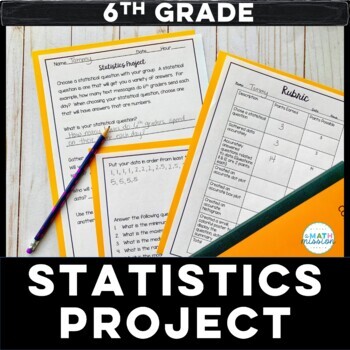
Math Statistics Project Based Learning Dot Plot Box Plot Histogram
Set your students loose to practice their statistics skills! This project is great for a culminating assessment. This project is centered around students coming up with a statistical question, and gathering data on that question. Students answer statistical questions, and create a dot plot, box and whisker plot and histogram based on the data collected. A summary of their findings is then created to display for others to see. A rubric is included for grading purposes. This project actively
Subjects:
Grades:
5th - 7th
Types:
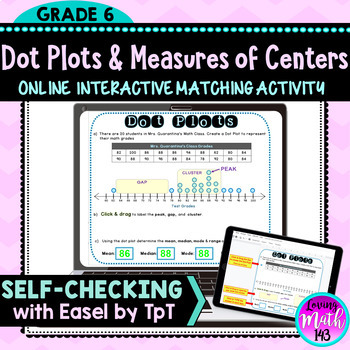
Dot Plots and Measures of Center Digital Activity for Distance Learning
Dot Plots & Measures of Center Interactive Activity for Distance LearningStudents will create a Dot Plot / Line Plot for a data set with 20 values. Students will identify the cluster, peak, and gap located on the Dot Plot. Students will also find the mean, median, mode, and range for the data set. it is a perfect resource for distance learning and students using Google Classroom™. This activity is interactive. Students will click and drag to move the dots to create the dot plot. In addition
Subjects:
Grades:
6th
Types:
Showing 1-24 of 1,378 results


