209 results
Statistics interactive notebooks $5-10
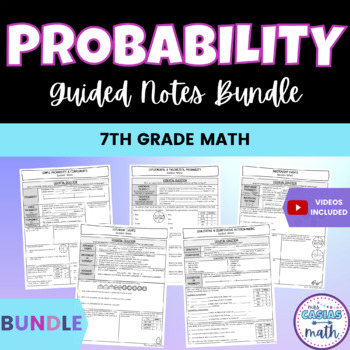
Probability 7th Grade Math Guided Notes Lessons BUNDLE
This bundle includes 8 concise, to the point and no-prep probability lessons. These notes are a great way to teach & introduce: Simple probability and complementsIndependent and dependent events Simulations and predictionsRandom samplingTheoretical and experimental probabilityThese notes are scaffolded and broken down well so that students develop a strong foundation before moving into trickier topics. Students and teachers love how easy these notes are to follow and understand. This bundle
Subjects:
Grades:
7th - 8th
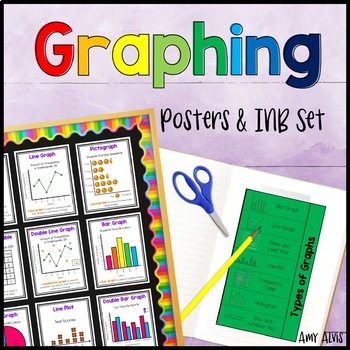
Graphing Posters & Interactive Notebook Bar Graph Picture Graph Line Plot
This poster or anchor chart and interactive notebook (INB) set includes FOURTEEN posters covering bar graphs, double bar graph, pictographs, picture graph, line graphs, double line graph, line plot, circle graphs, frequency tables, sector graph, stem and leaf plots, histograms, dot plots, parts of a graph and box and whisker plots. This set also includes SIX different foldable interactive notebook (INB) pages (that you print and put into a paper notebook) for students to take notes as well as a
Subjects:
Grades:
2nd - 5th
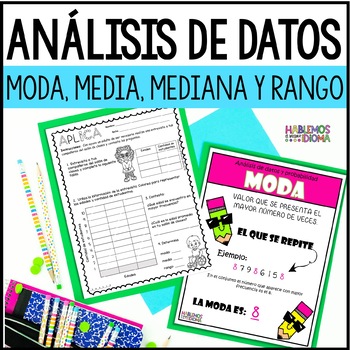
Análisis de datos moda, media, mediana y rango | Interpretación gráficas
¿Necesitas actividades para trabajar con tus estudiantes de grados primarios el análisis de datos (moda, media, mediana y rango) e interpretación de gráficas de una forma sencilla y divertida? Este recurso incluye carteles, hojas de trabajo, plegables para libreta interactiva y más.El siguiente recurso se llevó a cabo con la intención de ofrecer acceso curricular a la destreza de una forma sencilla y atractiva para el estudiante. El recurso se desarrolló para un aula inclusiva está dirigido a
Subjects:
Grades:
4th - 8th
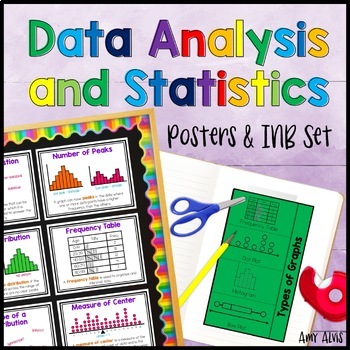
Data Analysis and Statistics Posters and Interactive Notebook INB Set
This poster (anchor chart) and interactive notebook (INB) set covers statistical questions, numerical data, categorical data, frequency table, dot plot, histogram, box and whisker plot, box plot, parts of a box and whisker plot, parts or a box plot, measure of center, spread, shape of distribution, symmetry, number of peaks, skewness, uniform distribution, outlier and gaps. The INB pages cover Types of Graphs, Statistical Questions and Patterns in Data.It includes 3 different interactive foldabl
Subjects:
Grades:
6th - 8th
Also included in: 6th Grade Posters and Interactive Notebook INB BUNDLE Anchor Chart
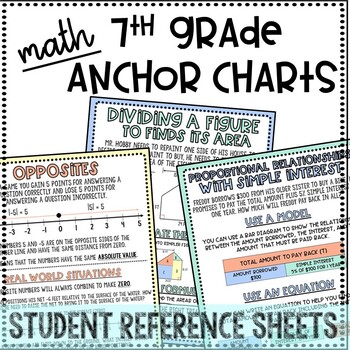
7th Grade Math Anchor Charts
Are you tired of writing and making Anchor Charts for each standard? Do you want you students to have a reference sheet for each lesson? These anchor charts/reference sheets solve that problem! You can print and laminate for your classroom. But more importantly, you can print the black and white versions for student notebooks or binders!You can print these as normal size paper, blow them up as posters, or print multiple on one sheet to have smaller versions! What is included?Color Version (witho
Subjects:
Grades:
7th
Also included in: 7th Grade Math Anchor Charts & Word Wall
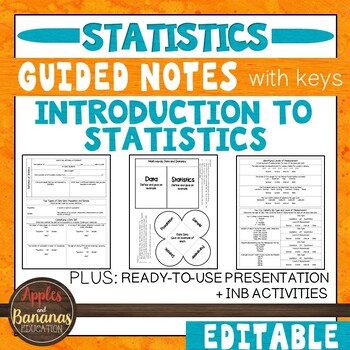
Introduction to Statistics - Guided Notes, Presentation, and INB Activities
This Introduction to Statistics product is flexible, editable, and can be used for in-person or distance learning. Take the time and stress out of creating your own guided notes and presentations. There are many ways to use this engaging bundle. It includes guided notes embedded with student practice problems (keys included), foldable activities, and a PowerPoint presentation for focused instruction. Choose what works best for your class/student and modify to make the content fit your needs. Not
Subjects:
Grades:
9th - 12th
CCSS:
Also included in: Custom Bundle for Viet
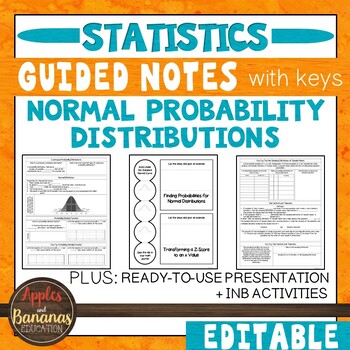
Normal Probability Distributions - Guided Notes, Presentation, + INB Activities
This Normal Probability Distributions (Statistics) product is flexible, editable, and can be used for in-person or distance learning. It includes guided notes embedded with student practice problems (keys included), foldable activities, and a PowerPoint presentation for focused instruction. Choose what works best for your class/student and modify to make the content fit your needs. Notes are designed to clearly present the topics and reach all types of learners. Take the time and stress out of c
Subjects:
Grades:
9th - 12th
CCSS:
Also included in: Custom Bundle for Viet
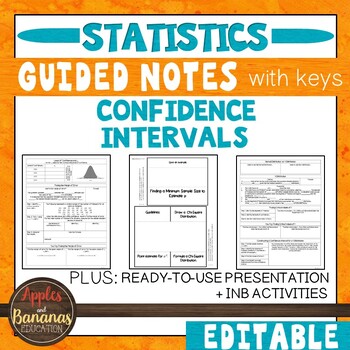
Confidence Intervals - Statistics Guided Notes, Presentation, +INB Activities
This Confidence Intervals (Statistics) product is flexible, editable, and can be used for in-person or distance learning. It includes guided notes embedded with student practice problems (keys included), foldable activities, and a PowerPoint presentation for focused instruction. Choose what works best for your class/student and modify to make the content fit your needs. Notes are designed to clearly present the topics and reach all types of learners. Take the time and stress out of creating your
Subjects:
Grades:
9th - 12th
CCSS:
Also included in: Custom Bundle for Viet
Probability - Guided Notes, Presentation, and Interactive Notebook Activities
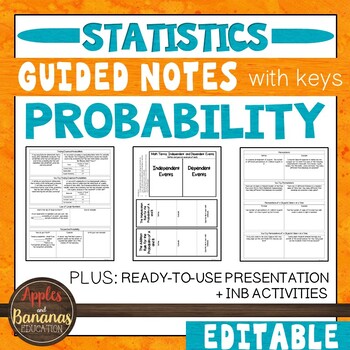
This Probability (Statistics) product is flexible, editable, and can be used for in-person or distance learning. It includes guided notes embedded with student practice problems (keys included), foldable activities, and a PowerPoint presentation for focused instruction. Choose what works best for your class/student and modify to make the content fit your needs. Notes are designed to clearly present the topics and reach all types of learners. Take the time and stress out of creating your own guid
Subjects:
Grades:
9th - 12th
CCSS:
Also included in: Custom Bundle for Viet
Statistics Guided Notes
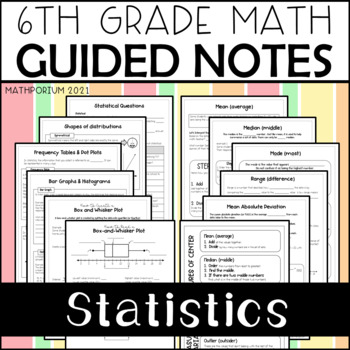
These guided notes are a great resource for teaching statistics. You can print them for students to have as reference, upload to your class page, or even create a math reference board in your classroom. The pages are perforated to fit into a spiral notebook.They are a great accommodation for students with special needs. They minimize writing to allow your students to focus on listening and learning. They shorten your lessons, freeing up time for other activities. You can even send the answer key
Subjects:
Grades:
6th
6th Grade Math Statistics Interactive Notebook Unit Printable TEKS CCSS
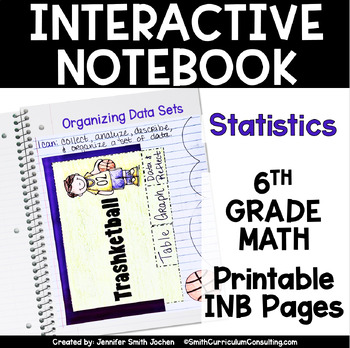
After starting an Interactive Notebook for 6th Grade Math, this unit provides not only the Flippables (foldable activities) but also items necessary to complete your INB lessons.This Sixth Grade Math Interactive Notebook provides alignment documents, teacher info pages for guided instruction (including the objective, vocabulary, standards, and directions), example photos, and all of the printable components for the lessons within the Statistics domain.Use the LOW-PREP interactive notebook lesson
Subjects:
Grades:
6th
Also included in: 4th, 5th and 6th Grade Math Interactive Notebook TEKS CCSS Aligned
Statistics: Measures of Center, Spread and Describing Shape
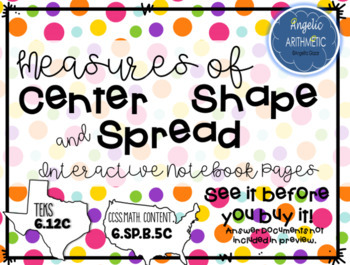
These interactive notebook pages include foldables for CENTER, SPREAD, and SHAPE of a data distribution.Center: Mode, Mean, MedianSpread: Range, Quartiles, Interquartile RangeShape: Symmetry and SkewExtra foldable to review Gaps, Outliers, Clusters, and FrequencyBONUS: Low prep folder activity.Plus: Large graphics pages for classroom use.Download the preview to see it before you buy it (Answer keys are not shown in the preview)!*******************************************************************
Subjects:
Grades:
6th - 7th
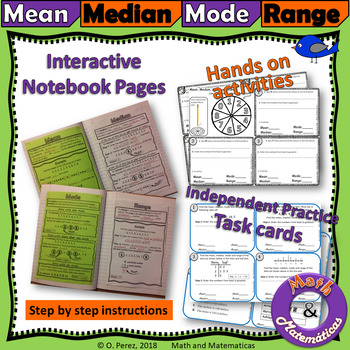
Mean, Median, Mode and Range Student Notes, Hands on Activities and Task Cards
This mean, median, mode and range activity includes notes for the interactive notebook that have step by step instructions on how to find the measurements of central tendency (measures of center), and spread (measures of variability). Includes activities with dice and spinners.Student Notes: includes notes for the interactive Notebook about Mean, Media, Mode and Range. One page for every 2 students. The notes are cloze notes and show the students, with examples, the process step by step.Hands on
Subjects:
Grades:
5th - 7th
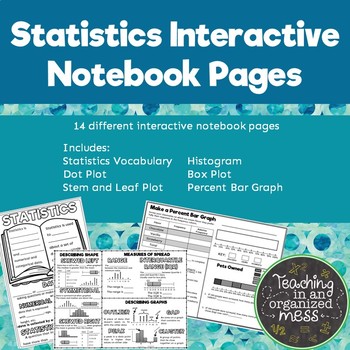
Types of Graphs and Statistics Math Notebook Pages
14 pages for an interactive notebook--over dot plot, stem and leaf plot, box plot, percent bar graph, and histograms. Common statistics vocabulary is also included like mean, median, mode, range, interquartile range, skewed, variability, etc.
For my statistics unit, I have my students collect their own data so they feel more connected to the graphs we are making. For each graph students will make, there is a question that students can answer to collect data. To make each graph, there are a var
Subjects:
Grades:
5th - 7th
Also included in: 6th Grade Math TEKS Interactive Notebook BUNDLE
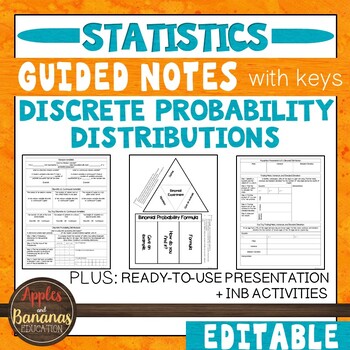
Discrete Probability Distributions - Notes, Presentation, and INB Activities
This Discrete Probability Distributions (Statistics) product is flexible, editable, and can be used for in-person or distance learning. It includes guided notes embedded with student practice problems (keys included), foldable activities, and a PowerPoint presentation for focused instruction. Choose what works best for your class/student and modify to make the content fit your needs. Notes are designed to clearly present the topics and reach all types of learners. Take the time and stress out of
Subjects:
Grades:
9th - 12th
CCSS:
Also included in: Custom Bundle for Viet
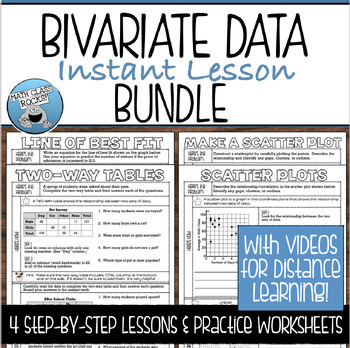
BIVARIATE DATA GUIDED NOTES AND PRACTICE BUNDLE
Save time and make your life easy with this set of BIVARIATE DATA GUIDED NOTES and PRACTICE WORKSHEETS! Perfect for introducing a new concept, reviewing a previously learned skill, or your interactive notebook! These guided notes will simplify every lesson with step-by-step examples and practice problems to provide a year-long resource for your students to refer to again and again!This lesson is included in my Linear Equations Instant Lesson BUNDLE. Click HERE to view this resource and SAVE 25%!
Subjects:
Grades:
7th - 9th
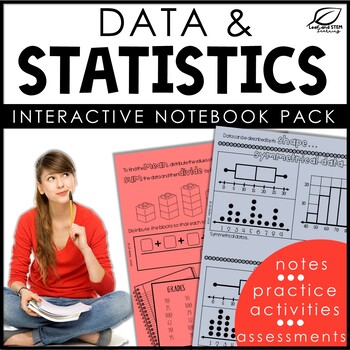
Data and Statistics Notes | Print & Digital
Teach your 6th grade data and statistics unit with this comprehensive set of notes, graphing activities, and data and statistics assessments! This unit is designed to fit neatly in your students' interactive notebooks while also providing easy to copy and use pages that take almost no time to prep.The first part of the unit covers how to create and read data using leaf-and-stem plots, dot plots, histograms, and box plots. Students use pre-made graphs and charts to learn about the important par
Subjects:
Grades:
6th
Also included in: 6th Grade Math TEKS Mega Bundle
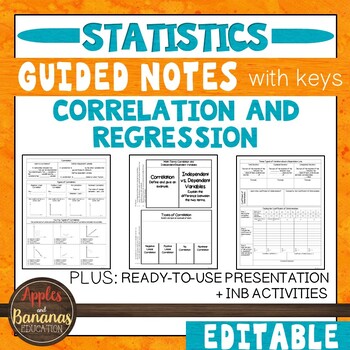
Correlation and Regression - Guided Notes, Presentation, and INB Activities
This Correlation and Regression (Statistics) product is flexible, editable, and can be used for in-person or distance learning. It includes guided notes embedded with student practice problems (keys included), foldable activities, and a PowerPoint presentation for focused instruction. Choose what works best for your class/student and modify to make the content fit your needs. Notes are designed to clearly present the topics and reach all types of learners. Take the time and stress out of creatin
Subjects:
Grades:
9th - 12th
CCSS:
Also included in: Custom Bundle for Viet
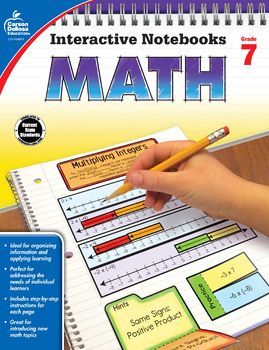
Interactive Notebook Math Workbook Grade 7 Printable 104911-EB
Personalize the learning process with the time-saving Interactive Notebooks: Math eBook for seventh grade!• This 96-page downloadable resource includes high-interest, hands-on activities about integers, proportions, expressions and inequalities, angle relationships, probability, and more.• Students will learn organization, color coding, summarizing, and other important skills while creating personalized portfolios of their individual learning that they can reference throughout the year.• Include
Subjects:
Grades:
7th
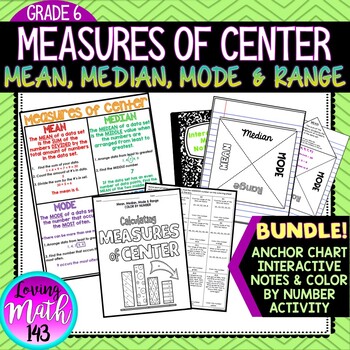
Mean Median Mode and Range Interactive Notes, Poster and Activity BUNDLE
Mean, Median, Mode & Range Color By Number ActivityThis color by number activity is a fun and engaging way for students to practice calculating the measures of center including mean, median, mode and range. Students will solve 16 questions involving mean, median mode, and range then find their answer on the color by number sheet. If their answer is not on the color by number then their answer is not correct. This activity is aligned with the sixth (6th) grade common core standards.WHATS INCL
Subjects:
Grades:
5th - 8th
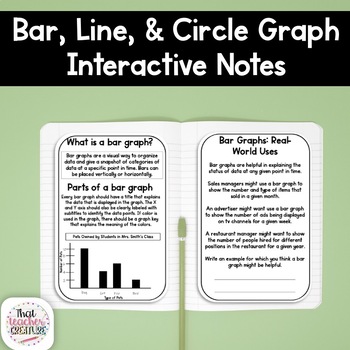
Bar, Line, and Circle Graph Interactive Notes
Make teaching bar, line, and circle graphs easier with these interactive notes! This no-prep set includes 3 sets of interactive notes perfect for exploring types of graphs. Quick and easy setup helps save you time and provides students with notes they need to understand the purpose, parts, and real-world uses of each type of graph. Here's what you'll get:purpose of a bar, line, and circle graphparts of a bar, line and circle graphreal world application of each type of graphguided practice - crea
Subjects:
Grades:
4th - 12th
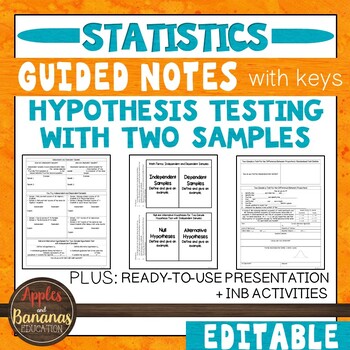
Hypothesis Testing with Two Samples - Guided Notes, Presentation, INB Activities
This Hypothesis Testing with Two Samples (Statistics) product is flexible, editable, and can be used for in-person or distance learning. It includes guided notes embedded with student practice problems (keys included), foldable activities, and a PowerPoint presentation for focused instruction. Choose what works best for your class/student and modify to make the content fit your needs. Notes are designed to clearly present the topics and reach all types of learners. Take the time and stress out o
Subjects:
Grades:
9th - 12th
CCSS:
Also included in: Custom Bundle for Viet
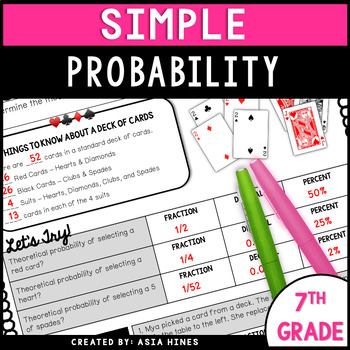
Theoretical Probability vs. Experimental Probability Notes
These theoretical probability vs. experimental probability notes are a great way to introduce theoretical and experimental probability and practice describing the difference between the two.Topics Included:Determining the theoretical and experimental probability of an eventDescribe the difference between the experimental and theoretical probability of an eventIncludes:Answer KeyPractice QuestionsYou may also be interested in:How to Make A Histogram Notes7th Grade Statistics and Probability Notes
Subjects:
Grades:
6th - 7th
Also included in: 7th Grade Math Guided Notes Full Year - 2016 Va Math SOLs
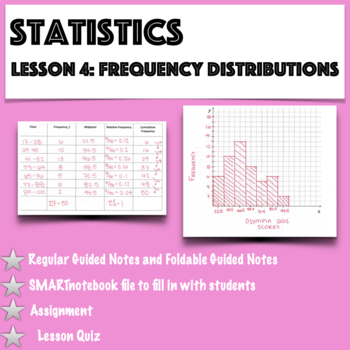
Statistics - Lesson 4: Frequency Distributions and their Graphs
This is the 4th lesson for an introductory statistics course and 1 of 5 lessons in this unit.Students will: -Be introduced to key vocabulary -Create a frequency distribution -Make a histogram, a frequency polygon, and an ogiveThere is another version of this lesson that comes with a video (see my store).In addition to guided notes (foldable or regular guided notes), the following is included: -SMARTnotebook file for the teacher to fill in with the students -Assignment to
Subjects:
Grades:
9th - 12th, Higher Education
Also included in: Statistics- Unit 2 Bundle: Describing Statistics
Showing 1-24 of 209 results


