3 results
Statistics cultural activities for Google Apps

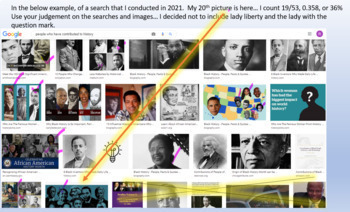
Women's History Month Probability Project
Students learn about suffrage and representatio of women. Students conduct Google searches on favorite subject, sport/hobby, future career and find the probability of a woman appearing in the first 20 images. Students make conjectures about representation of women in those areas. Students identify women they admire and create a video summarizing their findings.Can be adapted to images for African Americans for Black History Month, Hispanic Americans for Hispanic Heritage Month, etc.
Subjects:
Grades:
6th - 12th, Adult Education, Staff

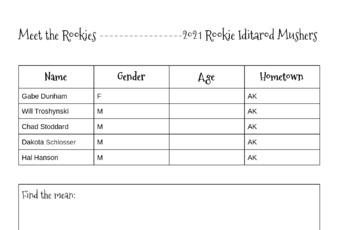
Iditarod Mean, Median, Mode, and Range
I made this mini-lesson to pre-teach mean, median, mode and range to students while their ELA class focused on a book study around the Iditarod. Students will use the Iditarod website to find the ages of the rookies who have their ages on the website. They will then find the mean, median, mode and range of those ages!**Please leave a review and check out my store for more!**
Subjects:
Grades:
4th - 7th
CCSS:

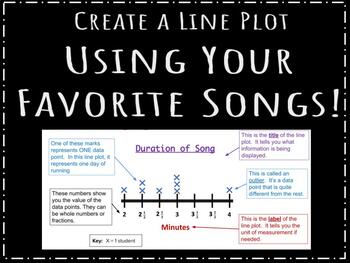
Fun Line Plot Assignment! (Minimal Prep)
Have students create a line plot using the time duration of their favorite songs! This is a great way for students to master learning the different parts of a line plot while also allowing them to "put a piece of themselves" in it! If students do not listen to music, they can use the current Top 10 most popular hits.Includes:- Slides to present to your students- Student handout for the activity
Subjects:
Grades:
5th - 7th
CCSS:
Showing 1-3 of 3 results


