TPT
Total:
$0.00
Selected

Subjects

Arts & Music
English Language Arts
Foreign Language
Holidays/Seasonal
Math
Science
Social Studies - History
Specialty
For All Subject Areas
202 results

High school Summer statistics outlines
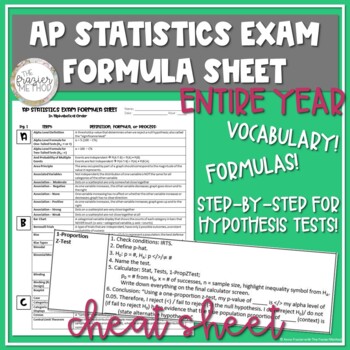
Preview of AP Statistics Review Vocabulary & Formulas for Entire Year, AP Stats Cheat Sheet
AP Statistics Review Vocabulary & Formulas for Entire Year, AP Stats Cheat Sheet

AN ENTIRE YEAR OF AP STATISTICS VOCABULARY, FORMULAS, & STEP-BY-STEP PROCESSES FOR CONFIDENCE INTERVALS AND HYPOTHESIS TESTS!!! Is AP Stats hard? Not with this all-in-one AP Statistics review of vocabulary, formulas, and step-by-step processes! Need some AP Statistics help? Use this product to help your students review for the AP Statistics Exam! This AP Statistics reference sheet includes definitions, formulas, and step-by-step processes for performing hypothesis tests and creating confiden
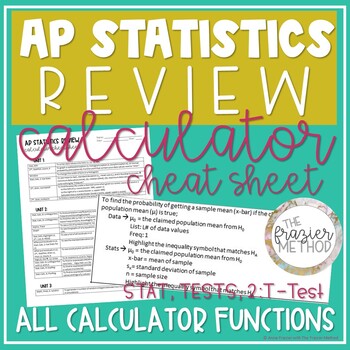
Preview of AP Statistics Review - Calculator Cheat Sheet for TI-84 Plus CE on AP Stats Exam
AP Statistics Review - Calculator Cheat Sheet for TI-84 Plus CE on AP Stats Exam

AN ENTIRE YEAR OF STATISTICS CALCULATOR FUNCTIONS for the TI-84 PLUS CE or TI-84 PLUS!!! Is AP Statistics hard? Not with this all-in-one AP Statistics calculator cheat sheet! Use this AP Statistics worksheet of calculator functions to help your students review for the AP Stats Exam! This AP Statistics reference sheet includes calculator functions from Units 1-7 - such as linear regression, probability formulas, graphs, re-expression, confidence intervals hypothesis tests, and more! This is a one
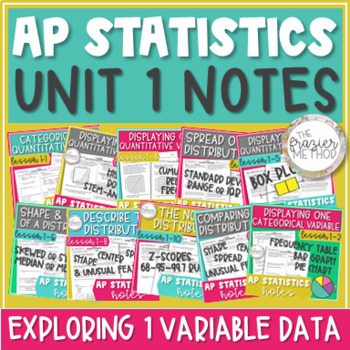
Preview of AP Statistics Notes Unit 1 Histogram, Box Plot, Skew, Mean, Normal Distribution
AP Statistics Notes Unit 1 Histogram, Box Plot, Skew, Mean, Normal Distribution

Use these AP® Statistics notes to teach UNIT 1 – EXPLORING ONE-VARIABLE DATA. Histograms, box plots, dot plots, stem-and-leaf plots, bar graphs, outliers, 5-number summary, z-scores, Normal Distribution / Normal Model, and describing a distribution's shape, center, & spread! Skewed or symmetric, median or mean, standard deviation or interquartile range... You can also use these notes for AP® Stats exam review! Aligns with the updated 2019-2020 objectives and standards of Unit 1: Exploring On
Preview of AP Statistics Notes Unit 3 Sampling Methods, Types of Bias, & Experiment Design
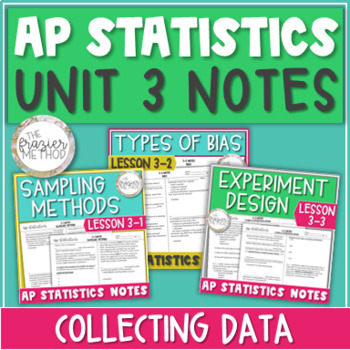
AP Statistics Notes Unit 3 Sampling Methods, Types of Bias, & Experiment Design

AP Statistics notes on SAMPLING METHODS : simple random sample, stratified sample, systematic sample, cluster sample, convenience sample... TYPES OF BIAS : undercoverage, nonresponse bias, response bias... and OBSERVATIONAL STUDIES & EXPERIMENT DESIGN : variables, treatments, control group, placebo, blocking, blinding, matched pairs, and more! Great for AP Stats Exam review! Aligns with AP College Board's updated 2019-2020 objectives and standards for AP Statistics Unit 3: Collecting Data. W
Preview of AP Statistics Notes Unit 4 Bundle - Probability Rules & Random Variables
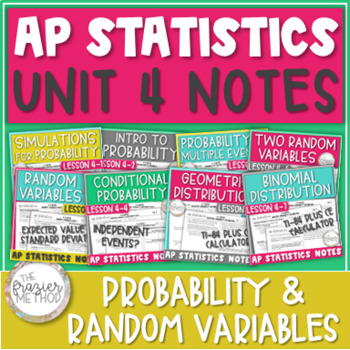
AP Statistics Notes Unit 4 Bundle - Probability Rules & Random Variables

AP Stats notes on PROBABILITY RULES : basic probability, complement, compound probability of multiple events, conditional probability, venn diagrams, simulations... RANDOM VARIABLES : expected value, standard deviation, sum and difference of two... and GEOMETRIC & BINOMIAL PROBABILITY DISTRIBUTIONS! Great for AP Statistics Exam review prep! Aligns with AP College Board's objectives and standards for AP Statistics Unit 4: Probabilities, Random Variables, & Probability Distributions. WHAT’
Preview of AP Statistics Flipbook Bundle! (Includes all objectives listed in 2019 CED!)
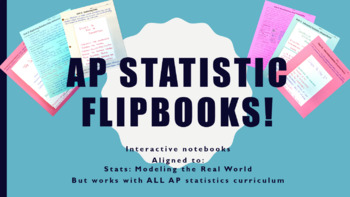
AP Statistics Flipbook Bundle! (Includes all objectives listed in 2019 CED!)

This resource has become a central focus of my class with overwhelmingly positive feedback from students, parents, and other teachers. An interactive note page with "flipable" 3x5 cards summarizing the important data found in Bock, Velleman, De Veaux's (BVD) Stats: Modeling the World. This is applicable to ALL editions. May be used with all AP Statistics classes with minimum editing. Included is an editable (word) document with the flipbook form (print on card stock for best results) and gradin
Preview of Bugs and Insects Clip Art Commercial use
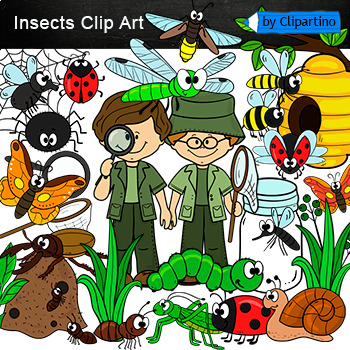
Bugs and Insects Clip Art Commercial use

Created by
Clipartino
Bugs and Insects Clip Art commercial use: empty bug jar * single net * magnifying glass * ladybug * mosquito * bee * Hive * wasp * spider * web * Gypsy * butterfly * ant * anthill * dragonfly * fly * grass * grasshopper * BoysFor personal and commercial useAll 28 files png transparent background+jpg 300dpi+28 files black white png+jpgYou'll like it!Bee life cycle FREE clipart / insect clipart freebiesInsects bugs Clipart/ Types of insect Clip Art realisticIt is allowed to use the clip arts (paid
Preview of AP Statistics Notes Unit 2 Scatterplot Linear Regression Residual Two Way Table
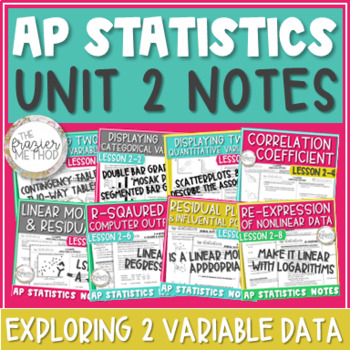
AP Statistics Notes Unit 2 Scatterplot Linear Regression Residual Two Way Table

AP® Statistics notes on UNIT 2 - EXPLORING TWO-VARIABLE DATA : contingency tables / two way tables, segmented bar graphs, scatterplots / scatter plots, correlation coefficient, linear models, residual plots, linear regression computer output, r-squared, and more! Great for AP® Stats Exam review prep! Aligns with updated 2020 objectives and standards for AP® Statistics Unit 2: Exploring Two-Variable Data. WHAT’S INCLUDED IN THIS PRODUCT?2-1 Notes - Contingency Tables2-2 Notes - Segmented Bar Grap
Preview of AP Statistics Notes Unit 7 Confidence Intervals & Hypothesis Tests for Means
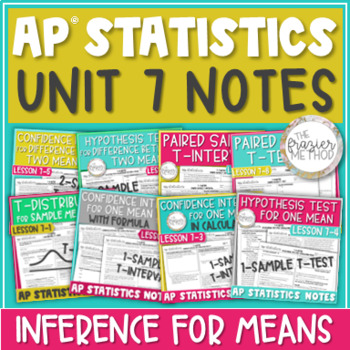
AP Statistics Notes Unit 7 Confidence Intervals & Hypothesis Tests for Means

8 AP® Statistics Notes on CONFIDENCE INTERVALS & HYPOTHESIS TESTS FOR SAMPLE MEANS. Through definitions, examples, and AP Stats FRQs, these notes teach through T-Distribution / T-Model, 1-Sample T-Interval, 1-Sample T-Test, 2-Sample T-Interval, 2-Sample T-Test, Paired Sample T-Interval, and Paired Sample T-Test. Each confidence interval and hypothesis test is taught by-hand with its formula and with its TI-84 Plus CE Calculator function. You can also use this bundle for AP® Statistics Exam p
Preview of AP Statistics Unit 6 Notes Confidence Interval & Hypothesis Test for Proportions
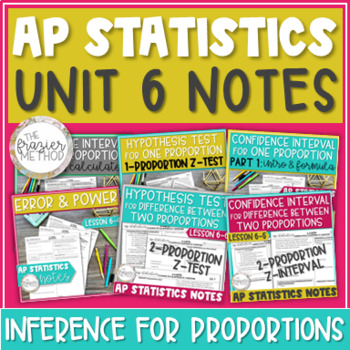
AP Statistics Unit 6 Notes Confidence Interval & Hypothesis Test for Proportions

AP Stats Notes on CONFIDENCE INTERVALS & HYPOTHESIS TESTS FOR PROPORTIONS! 1-Proportion Z-Interval, 1-Proportion Z-Test, Type 1 & 2 Errors, the Power of a Significance Test, 2-Proportion Z-Interval, and 2-Proportion Z-Test... each taught by-hand with its formula and with its TI-84 Plus CE Calculator function. Great for AP Stats Exam prep! Includes AP Stats FRQs! Aligns with AP College Board's updated 2019-2020 objectives and standards for AP Statistics Unit 6: Inference for Categorical
Preview of AP Statistics Notes Box Plot / Boxplot, Quartile, IQR, Outlier, 5 Number Summary
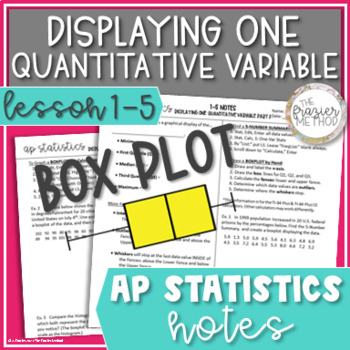
AP Statistics Notes Box Plot / Boxplot, Quartile, IQR, Outlier, 5 Number Summary

AP Stats notes to teach or review BOXPLOTS / BOX PLOTS / BOX-AND-WHISKER PLOTS! Define & calculate the median, interquartile range, 5-Number Summary, minimum, maximum, first quartile (Q1), third quartile (Q3), and percentiles for a set of data. Also, determine which data values are outliers based on the upper fence and lower fence of a boxplot. Students will graph box plots by hand given just a few of the data values and with step-by-step TI-84 Plus CE Calculator directions given the full li
Preview of AP Statistics Notes Normal Distribution Z-Scores Empirical Rule Normal Model
AP Statistics Notes Normal Distribution Z-Scores Empirical Rule Normal Model

Great AP Stats notes on the NORMAL DISTRIBUTION & Z-SCORES! Students will use the Normal Model and Empirical Rule (68-95-99.7% Rule) to find a data value, calculate z-scores, and find the area under the Normal curve using both the z-score formula and TI-84 Plus CE calculator functions. Students will also interpret z-scores in context, write the Normal Model notation N(µ, σ), and determine whether a data value can be considered “unusual.” Perfect for AP Stats Exam review prep! Aligns with AP
Preview of AP Statistics Notes Compound Probability of Multiple Events & Mutually Exclusive
AP Statistics Notes Compound Probability of Multiple Events & Mutually Exclusive

AP Statistics notes on COMPOUND PROBABILITY OF MULTIPLE EVENTS / AND & OR PROBABILITY RULES with VENN DIAGRAMS and Mutually Exclusive Events! Students will define and calculate the probability of Events A AND B, the probability of Events A OR B, and the probability of an event’s complement. Students will also determine whether events are MUTUALLY EXCLUSIVE. Use these notes pages as AP Stats Exam review prep! Aligns with AP College Board's objectives and standards for AP Statistics Unit 4: Pr
Preview of AP Statistics Notes Histograms, Dot Plots, & Stem-and-Leaf Plots - Data Displays
AP Statistics Notes Histograms, Dot Plots, & Stem-and-Leaf Plots - Data Displays

AP Stats notes to teach or review graphing and reading DOT PLOTS, STEM-AND-LEAF PLOTS, & HISTOGRAMS! Students will graph histograms using a TI-84 Plus CE Calculator and graph a dot plot and stem-and-leaf plot by hand. Practice problems and examples include answering questions about a set of data values displayed in a histogram. Great for AP Stats Exam prep! Aligns with AP College Board's updated 2019-2020 objectives and standards for AP Statistics Unit 1: Exploring One-Variable Data. WHAT’S
Preview of Linear Models & Residuals / Regression Line of Best Fit - AP Statistics Notes
Linear Models & Residuals / Regression Line of Best Fit - AP Statistics Notes

AP Stats Notes on LINEAR MODELS & RESIDUALS. Write the equation of a linear regression model from a list of data values and use step-by-step TI-84 Plus CE Calculator directions to find the equation of the Line of Best Fit / Least Squares Regression Line (LSRL). With formulas and the regression equation, calculate residuals (e), predicated values (y-hat), y-intercept, & slope of the linear model. Templates for “interpret in context” questions are also included! Great AP Stats Exam prep! A
Preview of AP Statistics Notes - UNIT 5 BUNDLE - Sampling Distributions Proportions & Means
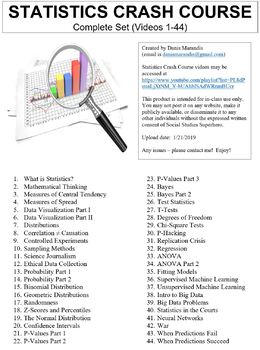
AP Statistics Notes - UNIT 5 BUNDLE - Sampling Distributions Proportions & Means

These AP Statistics notes will help you teach or review SAMPLING DISTRIBUTIONS FOR SAMPLE PROPORTIONS & SAMPLE MEANS! You can also use these notes pages to help your students review for the AP Statistics Exam! Aligns with AP College Board's objectives and standards for AP Statistics Unit 5: Sampling Distributions. WHAT’S INCLUDED IN THIS PRODUCT?5-1 Sampling Distributions of Sample Proportions2 Pages, Blank Pages & Answer KeyIntroduces sampling distributions and sampling distributions of
Preview of Crash Course Statistics Worksheets Complete Series Set Full Bundle Collection
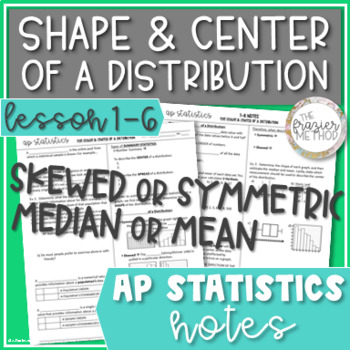
Crash Course Statistics Worksheets Complete Series Set Full Bundle Collection

Created by
Danis Marandis
This ZIP file contains Microsoft Word document worksheets (along with PDF versions) for each of the forty-four episodes of Crash Course Statistics hosted by Adriene Hill.Worksheets contain a combination of fill-in-the-blank and short answer questions. Each worksheet is accompanied with an answer key and relevant images.By purchasing this file, you agree not to make it publicly available (on external websites, etc.) or to share with any other teachers. It is intended for classroom use only. You *
Preview of AP Statistics Notes Shape & Center of Distribution, Median Mean, Skew Symmetric
AP Statistics Notes Shape & Center of Distribution, Median Mean, Skew Symmetric

Here's AP Stats notes on SHAPE & CENTER OF A DISTRIBUTION – SYMMETRIC OR SKEWED, MEDIAN & MEAN! Calculate the median and mean from a list of data values and estimate the median and mean from a histogram, boxplot, stem-and-leaf plot, dot plot, and cumulative relative frequency plot. Determine which measure of center to use based on the shape of the distribution – skewed or symmetric. Other terms defined in these notes include sample, population, statistics with symbols, parameters with sy
Preview of AP Statistics Notes Conditional Probability Venn Diagrams & Independent Events
AP Statistics Notes Conditional Probability Venn Diagrams & Independent Events

AP Statistics notes on CONDITIONAL PROBABILITY & INDEPENDENT EVENTS! Define and identify independent events, prove independence using P(B) = P(B|A), and calculate conditional probability from two-way tables. Aligns with AP College Board's objectives and standards for AP Statistics Unit 4: Probabilities, Random Variables, & Probability Models. WHAT’S INCLUDED IN THIS PRODUCT?Lesson 4-4: Probability Rules Part 3 – Conditional Probability & Independent EventsNOTES – 3 Pages, Blank Pages
Preview of AP Statistics Notes Describe the Distribution Shape, Center, Spread, Outliers
AP Statistics Notes Describe the Distribution Shape, Center, Spread, Outliers

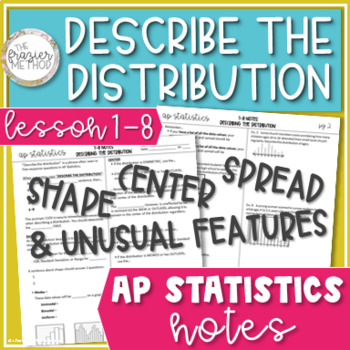
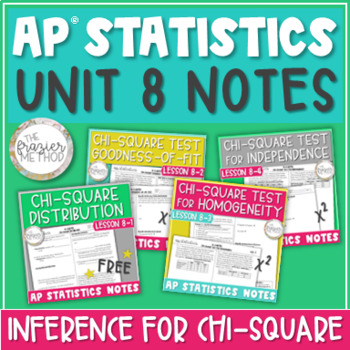
AP Stats notes on DESCRIBE THE DISTRIBUTION! Describe the shape as skewed or symmetric, center with median or mean, spread with standard deviation or interquartile range, and unusual features of histogram, box plot, stem-and-leaf plot, dot plot, & cumulative relative frequency plot. Also determine which measure of center (median or mean) and measure of spread (range, standard deviation, or interquartile range) to use based on the shape of the distribution (skewed or symmetric). Other terms d
Preview of AP Statistics Notes Inference for Chi-Square Distribution Goodness of Fit Test
AP Statistics Notes Inference for Chi-Square Distribution Goodness of Fit Test

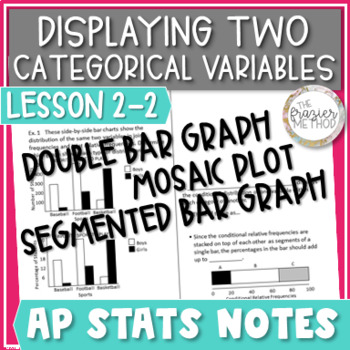
4 AP® Statistics Notes on CHI-SQUARE DISTRIBUTION, GOODNESS-OF-FIT TEST, TEST FOR HOMOGENEITY, and TEST FOR INDEPENDENCE from AP Stats Unit 8 Inference with Chi-Square. Through definitions, examples, and AP Stats FRQs, these notes teach through significance tests that use the Chi-Square Distribution / Chi-Square Model. Each hypothesis test is taught by-hand and with its TI-84 Plus CE Calculator function. You can also use this bundle for AP® Statistics Exam review prep! Aligns with the AP College
Preview of Segmented Bar Graph, Side-by-Side Bar Graph, & Mosaic Plot - AP Statistics Notes
Segmented Bar Graph, Side-by-Side Bar Graph, & Mosaic Plot - AP Statistics Notes

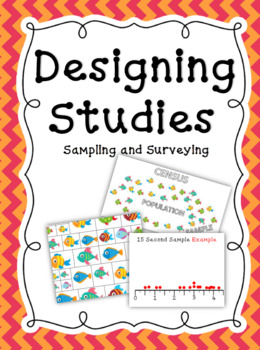
AP Stats Notes on graphing two categorical variables in a SEGMENTED BAR GRAPH, SIDE-BY-SIDE BAR GRAPH, & MOSAIC PLOT! Identify which graph(s) can display joint frequencies, joint relative frequencies, and/or conditional relative frequencies (conditional distribution). Define and distinguish between independent and associated variables. Great for AP Stats Exam review prep! Aligns with AP College Board's updated 2019-2020 objectives and standards for AP Statistics Unit 2: Exploring Two-Variabl
Preview of Sampling and Surveys AP Statistics

Sampling and Surveys AP Statistics

This lesson plan is perfect for introducing students to the different types of sampling methods. Students are tasked with helping find the mean fish size in a pond by taking different types of samples. Included are fish squares students can actually measure (cm) as well as dot plots for students to see the distribution of data from each type of sample.This pdf goes over:-Census, Population, Sample, 15-Second Sample, Judgmental Sample, SRS (simple random sample), Stratified Sample, Cluster Sample
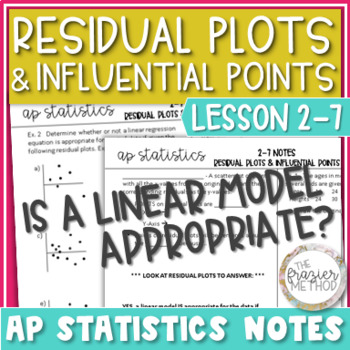
Preview of Residual Plots, Influential Points, & Extrapolation - AP Statistics Notes

Residual Plots, Influential Points, & Extrapolation - AP Statistics Notes

AP Stats Notes to teach or review linear regression’s RESIDUAL PLOTS, INFLUENTIAL POINTS, & EXTRAPOLATION. Includes step-by-step instructions for TI-84 Plus CE Calculators to create a list of residuals and graph the residual plot. Use a residual plot to answer the question “Is the linear model appropriate for the data?”, determine if a point on a scatterplot / scatter plot is influential, and recognize when extrapolation occurs. Aligns with AP College Board's updated 2019-2020 objectives and
Showing 1-24 of 202 results

Discover Summer Teaching Resources | TPT

Uncover more about Summer teaching resources

Teach with Summer Printables from TPT

Summer break is finally here, and while students are excited to kick back and relax, teachers may be searching for fun summer activities to keep their students engaged and learning throughout the summer months in June, July, and August. Luckily, there are plenty of fun and educational resources available that can help keep students motivated and inspired, even when the weather is hot and the sun is shining. In this article, we will explore some of the best summer resources and printables for teachers and students, covering a range of subjects and activities to suit all ages and interests. So, whether you're a teacher looking for new ideas, or a student looking for a fun way to keep learning, read on to discover the best summer resources and printables available.

Ideas for Summer Fun & Learning

  1. Summer Reading Lists and Worksheets

One of the best ways to keep students engaged and learning throughout the summer is to encourage them to read. Reading helps to build vocabulary, comprehension, and critical thinking skills, and can be a fun and relaxing way to spend a lazy summer day. To help promote summer reading, TPT offers a variety of summer reading lists and worksheets for students of all ages. These lists typically include a variety of books in different genres and reading levels, along with discussion questions and activities to help students engage with the material.

  1. STEM Activities and Experiments

For students who love science and technology, there are plenty of STEM activities and experiments available that can be done at home or in the classroom. These activities can help students build skills in areas such as coding, robotics, and engineering, while also encouraging creativity and problem-solving. Some popular STEM activities for summer include building and launching rockets, creating homemade ice cream, and designing and building a solar-powered car.

  1. Art Projects and Crafts

Summer is a great time to get creative, and there are plenty of art projects and crafts that students can do to express themselves and build their skills. From painting and drawing to sewing and pottery, there are endless possibilities for creative expression. Some popular summer art projects include creating a nature journal, making a homemade birdhouse, and designing and creating a summer-themed t-shirt.

  1. Virtual Field Trips

While traditional field trips may not be possible during the summer months, virtual field trips offer a fun and educational alternative. Many museums, zoos, and other attractions offer virtual tours and exhibits that allow students to explore and learn about different topics from the comfort of their own homes. Some popular virtual field trips for summer include exploring the Great Barrier Reef, visiting the Louvre Museum in Paris, and taking a tour of the NASA Space Center.

  1. Summer Worksheets and Printables

For students who prefer more structured learning activities, there are plenty of summer worksheets and printables available that cover a range of subjects and topics. These worksheets can help students build skills in areas such as math, science, and language arts, while also providing a fun and engaging way to learn. Some popular summer worksheets and printables include word searches, crossword puzzles, and coloring pages.

  1. Coloring Pages

Other popular resources to explore are summer coloring pages. Easy to print and sure to keep your kids busy, coloring pages are an excellent way for children to express their creativity, unwind, and improve their fine motor skills. Teachers Pay Teachers offers an extensive selection of summer coloring pages featuring beach scenes, road trips, family outings, and more. These printables are suitable for children of all ages and can be a great addition to your summer routine. Your kids will enjoy spending hours coloring these delightful pages and creating their own masterpieces.

Get Started with Summer Resources from TPT

Summer break is a great time for students to relax and recharge, but it's also important to keep their minds active and engaged. With these top summer resources and printables for teachers and students, you can help keep your students motivated and inspired throughout the summer months. Whether you're promoting summer reading, offering STEM activities and experiments, or providing fun and creative art projects and crafts, there are plenty of ways to keep your students learning and growing all summer long. So, try out some of these fun and educational resources and see how they can make this summer your best one yet!

Frequently asked questions:

Are there free summer activities on TPT?

TPT offers many free summer printables as well as resources available for purchase. This includes individual resources as well as resource bundles. Be sure to explore your options and choose resources that fit your budget and needs.

What is an example of a summer printable on TPT?

There are many different types of summer time activities on TPT that are appropriate for little ones as well as for older kids. This includes resources like: Summer Escape Rooms, book report templates, summer reading logs, summer bingo, math-review packets, and many more. Perfect for sunny or rainy days, these activities will keep your students busy in their free time when they aren't playing with friends in the local pool.

How can I make sure my students stay engaged and motivated during the summer months?

Keeping students engaged and motivated when they are not in school can be a challenge, but there are a few things you can do to help. Encouraging summer reading, offering a variety of fun activities and projects, and providing positive feedback and encouragement can all help to keep students motivated and interested in learning throughout the summer.