10 results
Common Core HSS-ID.A.2 resources for staff
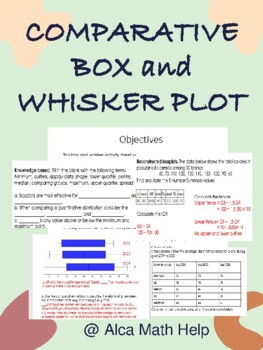
Comparison Box and Whisker Plots Worksheet, Quiz, Test for Stats & AP Stats
This box and whisker activity sheet was designed to test students understanding of the 5 number summary data values given quantitative data sets. Perfect for students in grade 10-12 doing statistics and you want to give them a challenge and should be manageable for students doing AP STATSAt the end of this activity students should be able to1. Students should be able to explain and construct box plots showing the different regions and what they represent. 2. Students should also be able to use
Subjects:
Grades:
11th - 12th, Higher Education, Adult Education, Staff
CCSS:
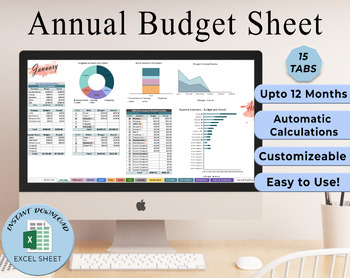
Annual Budget | Budget Template | Personal Budget | Excel Sheets Budget Annual
Annual Budget | Budget Template | Personal Budget | Excel Sheets BudgetCertainly! Here's a basic structure for an Annual Budget Spreadsheet in Microsoft Excel:1. **Income Section**: - Column A: Month (e.g., January, February, March, etc.) - Column B: Income Sources (e.g., Salary, Freelance Income, Rental Income, etc.) - Columns C through N: Monthly Income Amounts2. **Fixed Expenses Section**: - Column A: Expense Categories (e.g., Rent/Mortgage, Utilities, Insurance, Loan Payments, etc.)
Subjects:
Grades:
Higher Education, Adult Education, Staff
CCSS:

Mean Absolute Deviation No Prep Lesson
Mean Absolute Deviation: This packet contains worksheets on mean absolute deviation. These worksheets are great for differentiation and remediation.
This packet includes:
Anticipation Guide
Anticipation Guide Answer Key
Graphic Organizer
Error Analysis
Error Analysis Answer Key
Mean Absolute Deviation Worksheet
Mean Absolute Deviation Worksheet Answer Key
Mean Absolute Deviation Extra Practice Worksheet
Mean Absolute Deviation Extra Practice Worksheet Answer Key
Mean Absolute Deviation Ticket
Subjects:
Grades:
5th - 12th, Adult Education, Staff
Types:
CCSS:
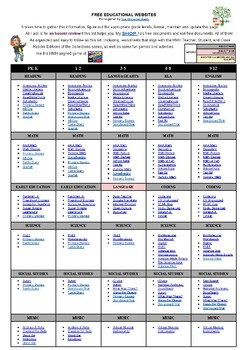
FREE EDUCATIONAL WEBSITES LIST 4 ALL GRADES K-12 AND SUBJECTS + TEACHER RESOURCE
Sometimes, you just need a list of websites for everyone. Here it is. FREE EDUCATIONAL WEBSITES Put together by Teach Me, Maria!It takes time to gather this information, figure out the appropriate grade levels, and format, maintain, and update this page. All I ask is for an honest review if this list helps you.
Subjects:
Grades:
PreK - 12th, Staff
Types:
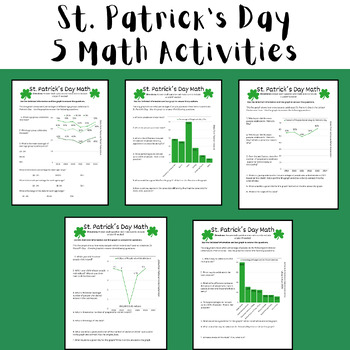
St. Patrick's Day Math Activities (Test Prep Data Analysis) Printable or Digital
These 5 activities are fun NO PREP math activities to do to celebrate St. Patrick's Day. The activities can be completed as 5 separate pages or as a 5 page packet. There is a customizable digital resource (Canva Template) and a printable resource (Canva) that contain the same directions and activity. This was designed for students in middle school, but could be used for upper elementary and high school students in Pre Algebra, Pre-Algebra, or Algebra.In this assignment, students are asked to:Gra
Subjects:
Grades:
3rd - 12th, Staff
Types:
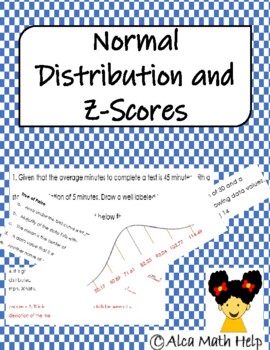
Normal Distibution and Z-Score- Statistics and AP Statistics
At the end of this activity students will be able to:•Calculate z-score and actual score/data value•Calculate standard deviation•Explain what is meant by unusual and or usual z-score•Create normal distribution curve (bell curve)•Use the 68-95-99.7 % rule to tell the regions of specific z-score •Answer sheet included!! This activity sheet can be used as a classwork, homework, pop quiz end of Unit Quiz.Marks should be personalized by teacher/users; also, students should be advised if they should s
Subjects:
Grades:
11th - 12th, Higher Education, Adult Education, Staff
Types:
CCSS:
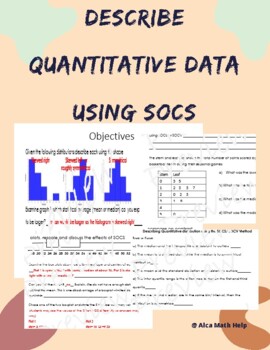
Describe Quantitative Data using SOCS/SOCV- Box plot, Histogram, Stem plot
If you are looking for a worksheet that can be used as a quiz, test, review packet you are at the right place. This activity sheet is suitable for students doing AP Stats and CP Probability and Statistics. This activity sheet allows students to:Use prior knowledge to answer true false questions and fill in the blanks with vocabulary provided.Describe box plots, histogram and stem plot using SOCS.Interpret the shape, center, outlier or any unusual feature along with the spread.
Subjects:
Grades:
11th - 12th, Higher Education, Adult Education, Staff
CCSS:

Entire year of Algebra 1 tests - 3 versions each - Similar to NYS Regents
This bundle includes 3 versions of each unit test for Algebra 1. The unit tests are: Introduction to AlgebraFunctionsLinear, Exponential Functions & SequencesSystems of EquationsQuadratic FunctionsPolynomialsStatisticsAlso included are 3 versions of quizzes for Equations and SequencesThis bundle has all units test you need for a complete Algebra 1 Common Core course. Each version is very similar to the others; the problems have different numbers but the type and level of problem is the same
Subjects:
Grades:
7th - 10th, Staff
Types:
CCSS:
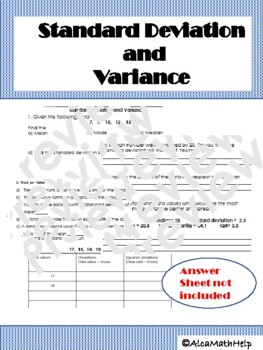
Standard Deviation and Variance AP Stats, CP probability and Statistics
If you are looking for an activity sheet that will help students to practice standard deviation and variance both by hand and the table. This is the activity you are looking for. Not too complex but requires some level of thinking.Objectives:1. Students should be able to interpret the relationship between the mean and standard deviation. 2. Students should know how the change in variables affects the spread and center. 3.Students will be able to complete a knowledge-based section by answering tr
Subjects:
Grades:
10th - 12th, Higher Education, Adult Education, Staff
CCSS:
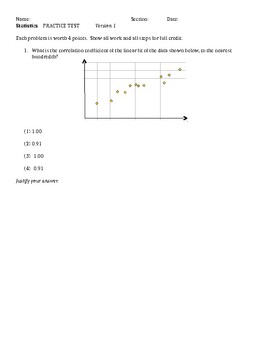
Algebra 1 Tests- Statistics Unit - 3 versions
Included are 3 versions of an Algebra 1 Unit Test on Statistics. The main topics being assessed are interpreting the correlation coefficient, comparing and computing measures of central tendency, finding the least squares regression line and making predictions, constructing a box and whisker plot, using quadratic regression and constructing and interpreting a residual graph. Each version is very similar to the others; the problems have different numbers but the type and level of problem is the
Subjects:
Grades:
8th - 10th, Staff
Types:
CCSS:
Showing 1-10 of 10 results

