12 results
Earth sciences Common Core 4.MD.B.4 resources

Plant Growth and Changes, Inquiry
Explore plant growth and changes in a hands-on and fun way with your students in this inquiry-based unit! Learn about plant growth, life cycles, and the needs of living things in this exciting, inquiry-based unit. First, students will learn foundational information and vocabulary about plants through two teacher-led activities and lessons. Next, students will participate in three engaging plant growth projects to experience plant growth and changes firsthand.What’s Included in this Plant Growth
Subjects:
Grades:
2nd - 4th
Types:
NGSS:
2-LS2-1
Also included in: Grade 3 Science Lessons BUNDLE, Digital and Printable
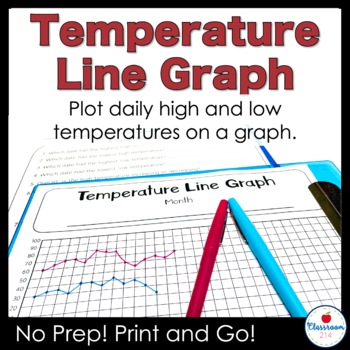
Weather Temperature Graph with Data Analysis Questions
Graph daily high and low temperatures on a line graph. At the end of the month, use the data analysis questions to promote critical thinking about temperature trends and practice graph reading skills. A perfect a weather unit, bell ringer or morning work assignment to sharpen math, earth science, and data analysis skills. WHAT'S INCLUDEDFahrenheit graph (-20 - 100 degrees Fahrenheit)Celsius graph (-20 - 40 degrees Celsius)Seven data analysis questions to be completed at the end of the monthAD
Subjects:
Grades:
2nd - 8th
Types:
NGSS:
3-ESS2-1
, MS-ESS2-5
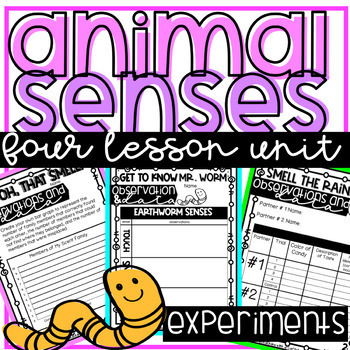
Animal and Human Senses Unit using the 5 Senses with Engaging Experiments
Just like humans, animals rely on their senses for survival. With this activity, your students will be exploring the different ways that animals use their senses to help interpret the world around them and, ultimately, survive!Your students will be completing hands on science experiments to help them better understand the importance of senses and the role they play in many animals' survival.This product includes:4 Engaging and Hands on Lessons15 Pages of Lesson Plans and Teacher TipsStudent Work
Subjects:
Grades:
3rd - 5th
Types:
NGSS:
3-5-ETS1-3
, 4-LS1-2
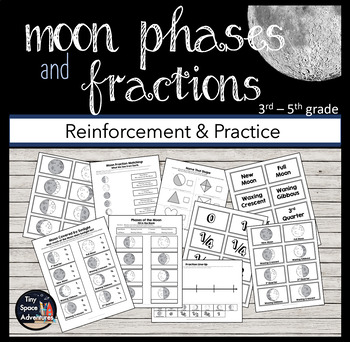
Moon Phases & Fractions
A great supplement to any phases of the moon unit! The worksheets in this packet are intended for reinforcement & practice of the phases of the moon and the numerical values that represent how much of the Moon is lit up by sunlight (as seen from Earth). Classroom stations, reinforcing phases of the moon/fractions or both! Students will have fun playing Memory with the phases of the moon to sharpen their fraction skills and reinforce the lunar phases. Five additional worksheets are also inc
Subjects:
Grades:
3rd - 7th
NGSS:
MS-ESS3-1
Sunrise and Sunset Photoperiod Graph Track Amount of Daylight
Collect weekly data on the sunrise and sunset times and create a bar graph with the average monthly photoperiod information. Includes a one-page description of why the amount sunlight changes and how it is connect to the seasons.This No Prep! Print and Go! activity takes just minutes each day and targets so many key science and math skills! Use the one-page description of why seasons and daylight change to fix a common misconception about what causes Earth's seasons and the changes in the am
Subjects:
Grades:
3rd - 8th
Types:
CCSS:
NGSS:
MS-ESS2-6
Layers of a Forest Big Book Non-Fiction Text
You've found a great non-fiction resource about forest layers. NOTE:**This is not a Rain Forest Book!** Very few teacher resources talk just about forests that are in North America, let alone Oklahoma!! This big book is 11x17 in size and full color with actual photography taken from forests in Oklahoma. While teaching about the layers of the forest, there are math comprehension questions along the way, graphs, maps, and diagrams to read that are all related to forests! There are lots of non-
Subjects:
Grades:
K - 7th
Types:
Compare Precipitation Between Tropical Rain Forests and Your Home State
This math activity can be used as a stand-alone assignment or included in a thematic unit study on Tropical Rainforests.The download contains three worksheets:1) A prepared chart for students to add precipitation data (rounded to the nearest 1⁄2 inch) for their home state. This information can be provided by the teacher/parent or students can look it up themselves at weatherbase.com. The data for Costa Rica is provided for you.2) A line graph to plot the data points for the students’ home state.
Subjects:
Grades:
3rd - 5th
Types:
CCSS:

FREE! At-a-Glance: Weather & Climate Unit (Science)
Not sure where to start with teaching fourth (4th) grade weather and climate? Stuck trying to make your unit quick enough to retain engagement, but don't want to sacrifice depth of knowledge? Stumbled upon my weather and climate unit resources, but need an idea of what order to use them in, and how many days to spend? Start here! This is by no means a unit plan, but rather a simple "at-a-glance" progression that pairs beautifully with the rest of my weather & climate bundle resources.
Subjects:
Grades:
3rd - 6th
NGSS:
3-ESS2-1
, MS-ESS2-4
, MS-ESS2-6
, MS-ESS2-5
, 4-ESS3-2
Excel Graphing Temperature Comparison
What's the temperature like in YOUR town? Does your curriculum include a study of weather factors? This Temperature Comparison Excel double-bar graph project can be an engagingway to:* integrate technology, math, science, and geography* introduce, extend, or enrich a math, social studies, or science topic of study* introduce or practice creating sheets and charts using Excel* give students a chance to make connections across the content areasThis classroom-tested project file includes: * student
Grades:
4th - 6th
Types:
NGSS:
5-ESS1-2
, 3-ESS2-1
, 3-ESS2-2
, 5-ESS2-1
, MS-ESS2-6
...

Graphing Wind Speeds
Digital activity to practice graphing coordinates with a science connection OR to learn about wind speeds with a math connection! Can be used as a print activity or virtual
Subjects:
Grades:
5th - 8th
Types:
CCSS:
NGSS:
MS-ESS2-6
, MS-ESS2-5
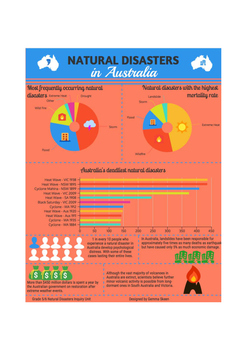
Natural Disasters in Australia Infographic
This infographic shows information about natural disasters in Australia. It can be used to accompany inquiry or science units about natural disasters or to interpret data.
Subjects:
Grades:
4th - 6th
Types:
Weather Tracking Worksheet | 15 Days
15 Days of Weather Tracking for StudentsExtension questions at the end with math connections!Graphing included
Subjects:
Grades:
3rd - 6th
Types:
NGSS:
4-ESS3-1
Showing 1-12 of 12 results

