35 results
High school statistics activboard activities for International Baccalaureate
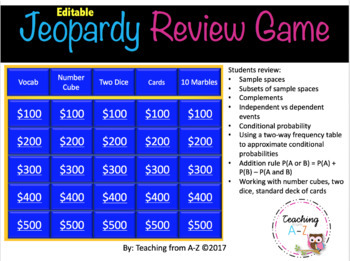
Probability Review Game
Use this Jeopardy-like review game to improve your students' understanding of key concepts in probability. This is a fun way to have students review:*Sample spaces*Subsets of sample spaces*Complements*Independent vs dependent events*Conditional probability*Using a two-way frequency table to approximate conditional probabilities*Addition rule P(A or B) = P(A) + P(B) – P(A and B)*Working with number cubes, two dice, standard deck of cardsThis is a PowerPoint Presentation. You can EDIT the problems
Subjects:
Grades:
9th - 12th
Also included in: Algebra Review Game Growing Bundle
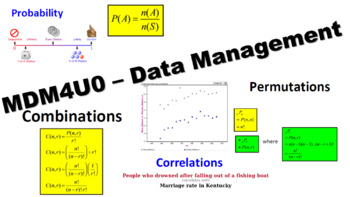
MDM4U - Grade 12 Math - Mathematics of Data Management - FULL COURSE!
This is my complete course package for the Grade 12 Data Management (MDM4U) course following the Ontario Secondary Mathematics Curriculum. This package includes:Smart Notebook and PowerPoint lessons with Student PDF versions for every lesson of every unit in the course. (I have also included versions with my notes for your use)A complete student workbook that covers every lesson in the course. Each lesson concludes with appropriate workbook sections, so you can use whatever textbook you want!App
Subjects:
Grades:
12th
CCSS:
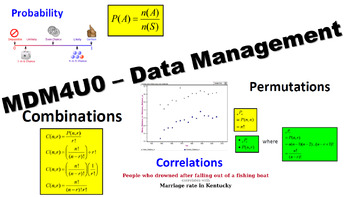
MDM4U - Probability Distributions Unit - Full Teacher Package
This is my complete Probability Distributions Unit package for the Grade 12 Data Management (MDM4U) course following the Ontario Secondary Mathematics Curriculum. This package includes:Smart Notebook and PowerPoint lessons with Student PDF versions for every lesson in the unit.A complete student workbook that covers every lesson in the unit. Each lesson concludes with appropriate workbook sections, so you can use whatever textbook you want!Appropriate unit tests/quizzes/assignments with answer k
Subjects:
Grades:
12th
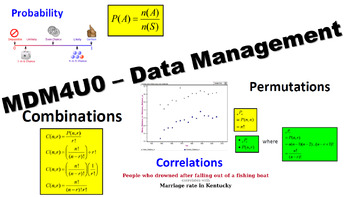
MDM4U - Statistical Analysis Unit - Full Teacher Package
This is my complete Statistical Analysis Unit package for the Grade 12 Data Management (MDM4U) course following the Ontario Secondary Mathematics Curriculum. This package includes:Smart Notebook, PowerPoint lessons with Student PDF versions for every lesson in the unit.A complete student workbook that covers every lesson in the unit. Each lesson concludes with appropriate workbook sections, so you can use whatever textbook you want!Appropriate unit tests/quizzes/assignments with answer keys.A fu
Subjects:
Grades:
12th
MDM4U - Organization of Data for Analysis Unit - Full Teacher Package
This is my complete Organization of Data for Analysis Unit package for the Grade 12 Data Management (MDM4U) course following the Ontario Secondary Mathematics Curriculum. This package includes:Smart Notebook and PowerPoint lessons with Student PDF versions for every lesson in the unit.A complete student workbook that covers every lesson in the unit. Each lesson concludes with appropriate workbook sections, so you can use whatever textbook you want!Appropriate unit tests/quizzes/assignments with
Subjects:
Grades:
12th
MDM4U - Counting and Probability Unit - Full Teacher Package
This is my complete Counting and Probability Unit package for the Grade 12 Data Management (MDM4U) course following the Ontario Secondary Mathematics Curriculum. This package includes:Smart Notebook and PowerPoint lessons with Student PDF versions for every lesson in the unit.A complete student workbook that covers every lesson in the unit. Each lesson concludes with appropriate workbook sections, so you can use whatever textbook you want!Appropriate unit tests/quizzes/assignments with answer ke
Subjects:
Grades:
12th

Statistics animated powerpoint lesson template
Content:1.Introduction2.Discrete Data3.Continuous Data4.Central Tendancy of a Data Set5.Range and Interquartile Range6.Box and Whisker Plot
Subjects:
Grades:
8th - 9th

Statistics animated powerpoint template lesson part 1
Statistics animated lesson:content:1.Introduction2.Discrete Data3.Continuous Data4.Central Tendancy of a Data Set
Subjects:
Grades:
8th - 9th
Also included in: Statistics animated powerpoint lesson template

Statistics animated powerpoint lesson template part 2
Statistics part 2:1.Range and Interquartile Range2.Box and Whisker Plot
Subjects:
Grades:
8th - 9th
Also included in: Statistics animated powerpoint lesson template
Math Escape Room For 11th and 12th Grade
If you are looking for a Math detective based team-building activity challenge to keep your students engaged with revision and learning about this topic, then this EDUCATIONAL ESCAPE ROOM is for you! There are seven detective inspired - but subject themed (trivia) challenges included in this file. Students will complete a variety of tasks using different skills including: problem-solving, critical thinking, reading comprehension, literacy challenges and some clever deduction. The puzzles, bonus
Subjects:
Grades:
7th - 12th
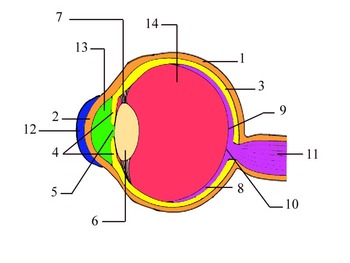
Structure and function of the eye
The aim of this kit is to help the students identifying the different parts of the eye, naming each and telling the function as well .
The kit contains the following items:
• A table describing the functions of 14 parts of the eye
• A black and white diagram showing the structure of the eye being labelled
• A power point presentation showing the parts of the eye being coloured one per slide so students can recognise which part is connected to which
• Another presentation showing the same part b
Grades:
7th - 12th
Probability Math Escape Room
This Math Escape Room themed on Probability covers key concepts relating to this topic such as Outcome, Impossible, Evens, Fractions, percentages and more! Escape Room is suitable for High School Math or Science students (Physics, Chemistry, Biology or Earth Sciences).Product contents:☞ Escape Room Interactive Tracker PowerPoint - Keeps the competitive nature on display☞ Escape Room Puzzle Keys (Six Sets for Six Teams)☞ Escape Room Team sheet - Record codes, answers clues as they progress throug
Subjects:
Grades:
7th - 11th
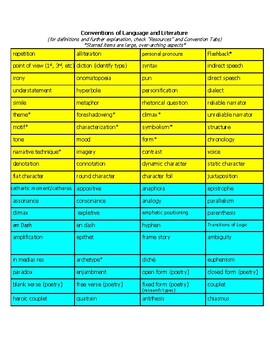
Conventions/Terminology Lists for Lang/Lit/Drama/Creative Non-Fict/Graphic Novel
If you struggle with getting your students to analyze beyond theme, symbolism, tone, etc., then these charts will help them to focus on deeper, more advanced levels of analysis. This four page document not only lists conventions often associated with language, literature, drama, creative non-fiction, and graphic novels, but it also ranks the terms by level of expertise. The yellow chart is basic, the blue chart is proficient, and the green chart is advanced. This is a great tool to use during
Grades:
9th - 12th, Higher Education, Adult Education
My Spanish Identity - First 6 lessons - My Spanish Identity includes DIGITAL
My Spanish Identity - First 6 lessons - My Spanish Identity includes DIGITAL - With integrated exercises - class presentation, class guide, printable handout for studentsGreetings and saying the namePersonal pronounsVerbs ending in arVerbs ser and estar - differencesVerbs to call each otherVerbs ending in er-irProfessions and gender of professionsNumbersPersonal presentationFirst production of descriptive textSaludos y decir el nombrePronombres personalesVerbos terminados en arVerbos ser y estar
Grades:
9th - 10th, Adult Education
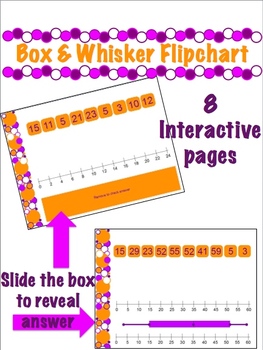
Box and Whisker Plot Flipchart for Promethean Board
This is a no frills Flipchart file for a Promethean Board. You need ActivInspire software to open and use it. It is 8 pages:Each page has a set of slidable data, a number line, and the answer behind a slidable box.It does NOT explain how to create a plot. It is practice for after your lesson.This addresses Common Core Standards: 6.SP.4 ans High School S-ID.1
Subjects:
Grades:
6th - 9th
Types:
CCSS:
Statistics Math Escape Room
This Math Escape Room themed on Statistics covers key concepts relating to this topic such as Medium, Mode, Mean, Range and more! This Escape Room can be used for High School Math, Statistics or Science students (Physics, Chemistry, Biology or Earth Sciences).How can this resource be adapted for social distancing?Upload / send the sheets digitally so students who can work independently through them (don’t use the keys or PPT tracker if so)Could use as part of a Recovery CurriculumSet the 7 Puzzl
Subjects:
Grades:
7th - 12th
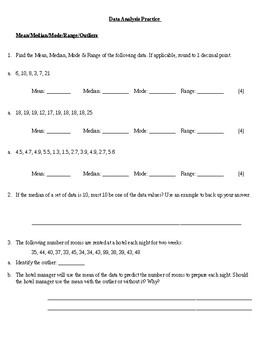
Data Analysis Practice (Mean, Median, Mode, Outliers, Graphing)
Worksheet practicing skills such as:
- Calculating Mean, Median, Mode, Range, Outliers
- Choosing the best graph/measure of central tendency
- Drawing & Analyzing Circe Grapgs
Subjects:
Grades:
5th - 9th

Classroom Essential Agreement Posters
Classroom Essential Agreement PostersHigh-quality teaching digital downloads and display materials, perfect for PYP teachers! Our products are specifically designed to help you engage and inspire your students in the classroom, while making your lesson preparation a breeze. Our digital downloads and display materials are carefully crafted to provide you with the best teaching experience possible.This packet includes the following printable:We try our best We are a team We respect each otherWe ha
Grades:
K - 9th, Adult Education, Staff

Key Concept Display - IB PYP
All 8 PYP IB Key Concepts Form: What is it like?Function: How does it work?Causation: Why is it the way it is?Change: How is it changing?Connection: How is it connected to other things?Perspective: What are the points of view?Responsibility: What is our responsibility?Reflection: How do we know?I value your feedback very much as it helps me determine which products are most valuable for your classroom so I can create more for you. You will also earn points towards your next TPT purchases.Be sure
Grades:
K - 12th, Higher Education, Adult Education, Staff
Mathematical Logic - Jeopardy Review
In my IB Math Studies class, I used this Jeopardy game to help my students review before their unit test on Logic. The Jeopardy game is broken down into 4 categories, with questions of various point values:
Category 1: Logic Symbols
Category 2: Converse and Friends (Converse, Inverse, Contrapositive)
Category 3: Truth Tables
Category 4: Mixed Review (mostly Probability and Venn Diagrams)
The answer is revealed when the teacher clicks with the mouse or presses Enter. The PowerPoint is also li
Grades:
8th - 11th
Types:
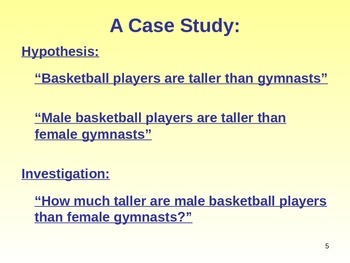
MEAN, MEDIAN, MODE AND RANGE, INTER-QUARTILE RANGE
This lesson focuses on different types of averages, the location and spread of data, and the pro's and con's of each. The power point uses a case study to help explain how mean, median, mode, range and inter-quartiles are calculated, and what each type of statistic shows. This lesson is designed to be interactive, with questions/ answers included. This also reduces the need for printing. Although originally designed for GCSE, this resource will prove useful in any math lesson. Learning aims are
Subjects:
Grades:
8th - 11th
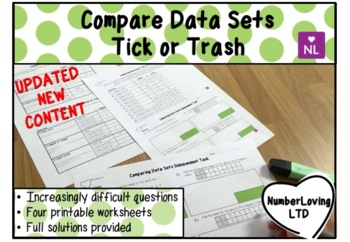
Comparing Data Sets (Tick or Trash)
Test your students' ability to spot mistakes and develop their understanding with this activity. Pupils are given two different answers to a question and have to determine which is correct. They then have to explain what misconception has led to the incorrect answer. This resource covers the topic of comparing data represented in lists using mode, median, mean and range, and interquartile ranges. There are three tick or trash worksheets and one independent extension task. The four worksheets in
Subjects:
Grades:
7th - 10th
Also included in: BUNDLE Tick or Trash Worksheets
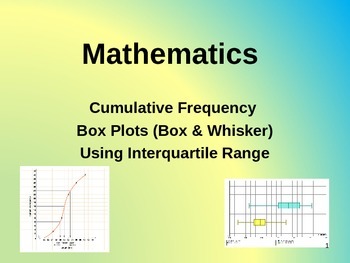
CUMULATIVE FREQUENCY, BOX PLOTS (BOX & WHISKER DIAGRAMS) & INTERQUARTILE RANGE
This lesson looks at plotting cumulative frequency curves from tables and using box plots (box and whisker diagrams) to analyse the data from these. Interquartile range is also included/ explored. This lesson aims to show learners how to draw and understand cumulative curves in a step-by-step way that is both visual and interactive, with questions and answers included. This also reduces the need for printing and makes good, printable revision notes. This resource will prove useful in any maths l
Subjects:
Grades:
7th - 12th
Showing 1-24 of 35 results

