32 results
High school statistics activboard activities for GATE
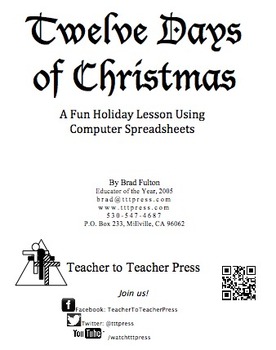
12 Days of Christmas: A Computer Spreadsheet Activity
This great holiday activity shows students how to use a computer spreadsheet to calculate the cost of their true love's gifts in today's dollars.The simple step-by-step procedure will allow both beginning and computer-savvy students to experience success as they learn how to use spreadsheet software. Students will enjoy the engaging and entertaining activity. No computer? No problem! Use the activity master so students can calculate the costs themselves.
Grades:
5th - 9th
Types:

Statistics Survey Project - Project Based Learning (PBL) with Math
Watch your students dive into the world of math as they create, execute, and analyze their own survey! Students will demonstrate mastery of data gathering, survey sampling, developing appropriate survey questions, data tables, Direct Variation, discrete graphs, dot plots, box and whisker graphs, and calculating the inter-quartile range.The Unique Survey Project is highly engaging, capitalizing on the innate curiosity of the adolescent mind. You will love the low-prep instructional guide. Your st
Subjects:
Grades:
6th - 10th
Types:
Also included in: Fun with Ratios Activities Bundle - 7th Grade PBL with Math
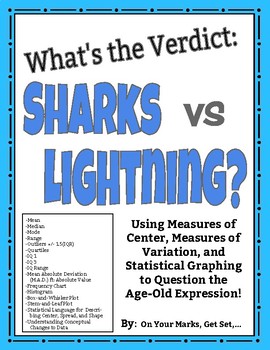
What's the Verdict: Sharks vs. Lightning? Modes of Center, Spread, and More!
Put it to the test! Use the age-old expression: "You are more likely to get struck by lightning than to be bitten by a shark!" to learn and practice Measures of Center, Measures of Spread, Measures of Shape, and Statistical Graphing including:MEANMEDIANMODERANGEOUTLIERS [Using IQR +/- 1.5(IQR)]QUARTILES [lower quartile (IQ-1) and upper quartile (IQ-3)]INTERQUARTILE RANGE (IQR)MEAN ABSOLUTE DEVIATION/ M.A.D. ft. ABSOLUTE VALUESYMMETRY/ASYMMETRY OF DISTRIBUTIONCLUSTERS AND GAPSBELL SHAPED CURVE AN
Subjects:
Grades:
5th - 12th, Higher Education, Adult Education
Types:
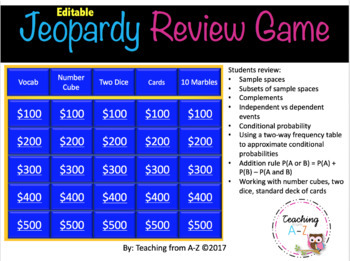
Probability Review Game
Use this Jeopardy-like review game to improve your students' understanding of key concepts in probability. This is a fun way to have students review:*Sample spaces*Subsets of sample spaces*Complements*Independent vs dependent events*Conditional probability*Using a two-way frequency table to approximate conditional probabilities*Addition rule P(A or B) = P(A) + P(B) – P(A and B)*Working with number cubes, two dice, standard deck of cardsThis is a PowerPoint Presentation. You can EDIT the problems
Subjects:
Grades:
9th - 12th
Also included in: Algebra Review Game Growing Bundle
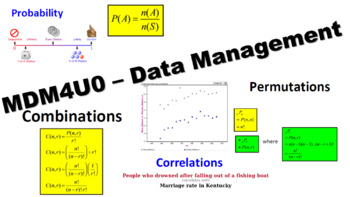
MDM4U - Grade 12 Math - Mathematics of Data Management - FULL COURSE!
This is my complete course package for the Grade 12 Data Management (MDM4U) course following the Ontario Secondary Mathematics Curriculum. This package includes:Smart Notebook and PowerPoint lessons with Student PDF versions for every lesson of every unit in the course. (I have also included versions with my notes for your use)A complete student workbook that covers every lesson in the course. Each lesson concludes with appropriate workbook sections, so you can use whatever textbook you want!App
Subjects:
Grades:
12th
CCSS:
MDM4U - Statistical Analysis Unit - Full Teacher Package
This is my complete Statistical Analysis Unit package for the Grade 12 Data Management (MDM4U) course following the Ontario Secondary Mathematics Curriculum. This package includes:Smart Notebook, PowerPoint lessons with Student PDF versions for every lesson in the unit.A complete student workbook that covers every lesson in the unit. Each lesson concludes with appropriate workbook sections, so you can use whatever textbook you want!Appropriate unit tests/quizzes/assignments with answer keys.A fu
Subjects:
Grades:
12th
MDM4U - Organization of Data for Analysis Unit - Full Teacher Package
This is my complete Organization of Data for Analysis Unit package for the Grade 12 Data Management (MDM4U) course following the Ontario Secondary Mathematics Curriculum. This package includes:Smart Notebook and PowerPoint lessons with Student PDF versions for every lesson in the unit.A complete student workbook that covers every lesson in the unit. Each lesson concludes with appropriate workbook sections, so you can use whatever textbook you want!Appropriate unit tests/quizzes/assignments with
Subjects:
Grades:
12th
MDM4U - Probability Distributions Unit - Full Teacher Package
This is my complete Probability Distributions Unit package for the Grade 12 Data Management (MDM4U) course following the Ontario Secondary Mathematics Curriculum. This package includes:Smart Notebook and PowerPoint lessons with Student PDF versions for every lesson in the unit.A complete student workbook that covers every lesson in the unit. Each lesson concludes with appropriate workbook sections, so you can use whatever textbook you want!Appropriate unit tests/quizzes/assignments with answer k
Subjects:
Grades:
12th
MDM4U - Counting and Probability Unit - Full Teacher Package
This is my complete Counting and Probability Unit package for the Grade 12 Data Management (MDM4U) course following the Ontario Secondary Mathematics Curriculum. This package includes:Smart Notebook and PowerPoint lessons with Student PDF versions for every lesson in the unit.A complete student workbook that covers every lesson in the unit. Each lesson concludes with appropriate workbook sections, so you can use whatever textbook you want!Appropriate unit tests/quizzes/assignments with answer ke
Subjects:
Grades:
12th
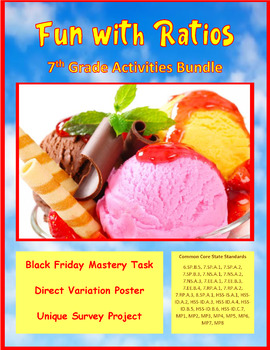
Fun with Ratios Activities Bundle - 7th Grade PBL with Math
The purpose of the Fun with Ratios Activities Bundle is to give students the opportunity to use creativity to apply ratios, proportions, and percentages in real-world settings. This bundle includes three unique tasks: Black Friday Mastery Task, Direct Variation Poster Mastery Task, and the Unique Survey Project. These activities and their accompanying materials are suited for students in grades 7 through 9. These lessons make excellent sub plans. Each project takes approximately two 60-minute bl
Subjects:
Grades:
7th - 9th
Types:

Statistics animated powerpoint lesson template
Content:1.Introduction2.Discrete Data3.Continuous Data4.Central Tendancy of a Data Set5.Range and Interquartile Range6.Box and Whisker Plot
Subjects:
Grades:
8th - 9th

Statistics animated powerpoint template lesson part 1
Statistics animated lesson:content:1.Introduction2.Discrete Data3.Continuous Data4.Central Tendancy of a Data Set
Subjects:
Grades:
8th - 9th
Also included in: Statistics animated powerpoint lesson template

Statistics animated powerpoint lesson template part 2
Statistics part 2:1.Range and Interquartile Range2.Box and Whisker Plot
Subjects:
Grades:
8th - 9th
Also included in: Statistics animated powerpoint lesson template
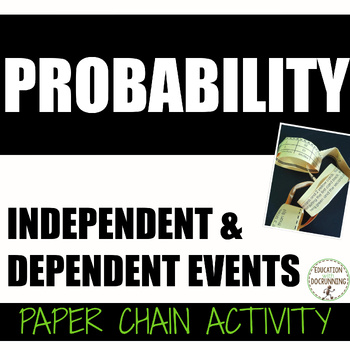
Probability Independent and Dependent Events Activity Paper Chain
Engage students at centers or in partners with this Probability Independent and Dependent Events Paper Chain Activity. Students solve probability questions involving tables, word problems, and diagrams. One link which leads to the answer on the next link. My students LOVE this activity. This resource includes:- Paper chain links with Probability problems- Answer key- Teacher's guide.A great addition to your middle school math curriculum and for differentiation.Also available in money-saving
Subjects:
Grades:
7th - 9th
Types:
CCSS:
Also included in: 7th Grade Math Activities Paper Chains Bundle
Math Escape Room For 11th and 12th Grade
If you are looking for a Math detective based team-building activity challenge to keep your students engaged with revision and learning about this topic, then this EDUCATIONAL ESCAPE ROOM is for you! There are seven detective inspired - but subject themed (trivia) challenges included in this file. Students will complete a variety of tasks using different skills including: problem-solving, critical thinking, reading comprehension, literacy challenges and some clever deduction. The puzzles, bonus
Subjects:
Grades:
7th - 12th
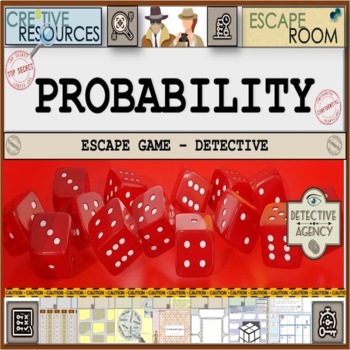
Probability Math Escape Room
This Math Escape Room themed on Probability covers key concepts relating to this topic such as Outcome, Impossible, Evens, Fractions, percentages and more! Escape Room is suitable for High School Math or Science students (Physics, Chemistry, Biology or Earth Sciences).Product contents:☞ Escape Room Interactive Tracker PowerPoint - Keeps the competitive nature on display☞ Escape Room Puzzle Keys (Six Sets for Six Teams)☞ Escape Room Team sheet - Record codes, answers clues as they progress throug
Subjects:
Grades:
7th - 11th
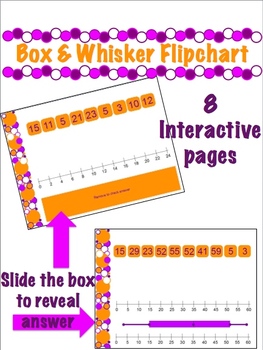
Box and Whisker Plot Flipchart for Promethean Board
This is a no frills Flipchart file for a Promethean Board. You need ActivInspire software to open and use it. It is 8 pages:Each page has a set of slidable data, a number line, and the answer behind a slidable box.It does NOT explain how to create a plot. It is practice for after your lesson.This addresses Common Core Standards: 6.SP.4 ans High School S-ID.1
Subjects:
Grades:
6th - 9th
Types:
CCSS:
Statistics Math Escape Room
This Math Escape Room themed on Statistics covers key concepts relating to this topic such as Medium, Mode, Mean, Range and more! This Escape Room can be used for High School Math, Statistics or Science students (Physics, Chemistry, Biology or Earth Sciences).How can this resource be adapted for social distancing?Upload / send the sheets digitally so students who can work independently through them (don’t use the keys or PPT tracker if so)Could use as part of a Recovery CurriculumSet the 7 Puzzl
Subjects:
Grades:
7th - 12th
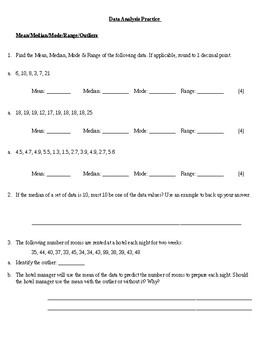
Data Analysis Practice (Mean, Median, Mode, Outliers, Graphing)
Worksheet practicing skills such as:
- Calculating Mean, Median, Mode, Range, Outliers
- Choosing the best graph/measure of central tendency
- Drawing & Analyzing Circe Grapgs
Subjects:
Grades:
5th - 9th
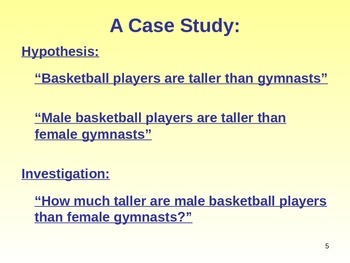
MEAN, MEDIAN, MODE AND RANGE, INTER-QUARTILE RANGE
This lesson focuses on different types of averages, the location and spread of data, and the pro's and con's of each. The power point uses a case study to help explain how mean, median, mode, range and inter-quartiles are calculated, and what each type of statistic shows. This lesson is designed to be interactive, with questions/ answers included. This also reduces the need for printing. Although originally designed for GCSE, this resource will prove useful in any math lesson. Learning aims are
Subjects:
Grades:
8th - 11th
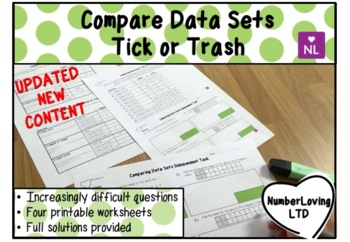
Comparing Data Sets (Tick or Trash)
Test your students' ability to spot mistakes and develop their understanding with this activity. Pupils are given two different answers to a question and have to determine which is correct. They then have to explain what misconception has led to the incorrect answer. This resource covers the topic of comparing data represented in lists using mode, median, mean and range, and interquartile ranges. There are three tick or trash worksheets and one independent extension task. The four worksheets in
Subjects:
Grades:
7th - 10th
Also included in: BUNDLE Tick or Trash Worksheets
A Fun Introduction to Probability
This product contains fourteen pages that introduce probability by graphing the LEGOs and comparing the number of studs on LEGO bricks. These statistics will be figured in fractions, decimals and percentages. Graphing will be done on bar graphs and pie graphs. The worksheets are colorful and engaging for students. Students will learn to find the mean, median and mode of different numbers of studs on LEGO bricks. Students will find their own statistics and combine them with the statistics of ot
Subjects:
Grades:
4th - 9th
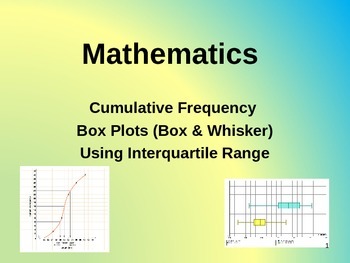
CUMULATIVE FREQUENCY, BOX PLOTS (BOX & WHISKER DIAGRAMS) & INTERQUARTILE RANGE
This lesson looks at plotting cumulative frequency curves from tables and using box plots (box and whisker diagrams) to analyse the data from these. Interquartile range is also included/ explored. This lesson aims to show learners how to draw and understand cumulative curves in a step-by-step way that is both visual and interactive, with questions and answers included. This also reduces the need for printing and makes good, printable revision notes. This resource will prove useful in any maths l
Subjects:
Grades:
7th - 12th
Trigonometry Math Escape Room
This Math Escape Room themed on Trigonometry covers key concepts relating to this topic such as Theorem, Triangles, Theta, Angles and more! Escape Room is suitable for High School Math or Science students (Physics, Chemistry, Biology or Earth Sciences). How can this resource be adapted for social distancing?Upload / send the sheets digitally so students who can work independently through them (don’t use the keys or PPT tracker if so)Could use as part of a Recovery CurriculumSet the 7 Puzzles
Subjects:
Grades:
7th - 12th
Showing 1-24 of 32 results


