31 results
Algebra simulations for homeschool

Line of Best Fit and Scatterplots
Who doesn't love a good mystery?!!!! In this engaging students use a real life scenario to apply scatterplot data of shoe size and height and the line of best fit to capture the correct suspect. This product has lots of great reviews! Many middle school math teachers state this was a great way to review the concept of line of best fit and scatterplots. Aligned to CCSSM8.SP.A.2 and CCSSM8.SP.A.3This activity is also available in a bundle at a discounted rate:Scatterplots and Line of Best
Subjects:
Grades:
7th - 9th
Types:
Also included in: Line of Best Fit and Scatterplots: The Bundle
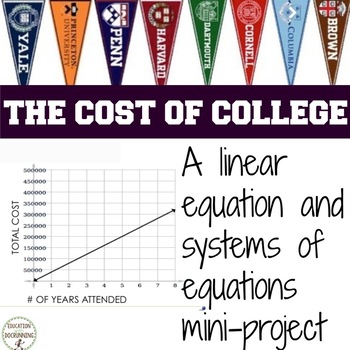
Linear Equations Project Cost of College
Bring real-world applications that are relevant to students with this linear equations project on college costs. Students examine the cost of individual colleges and compare colleges using linear equations. For students ready for systems of equations, students evaluate the impact of grant money on the overall cost. Great to get students thinking about and researching colleges now! Included in this resource:- Ready-to-use student pages- Teacher's Guide- Answer Key- Separate powerpoint file w
Subjects:
Grades:
10th - 12th
Types:
CCSS:
Also included in: Algebra 2 Curriculum
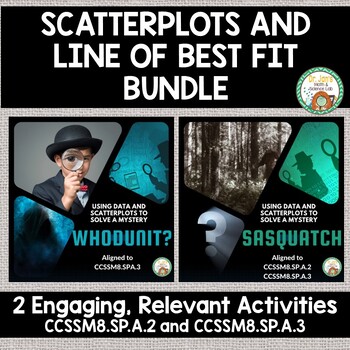
Line of Best Fit and Scatterplots: The Bundle
This bundle includes 2 engaging activities where students can apply the skills of plotting points in a scatterplot, making a line of best fit, and finding the slope of the line to find missing data. Fun scenarios of Sasquatch and a crime scene hook kids into learning. Please leave feedback, you can earn TpT credits for future purchases. If you enjoy these activities consider following my store as I work to increase my middle school math inventory. Check out my other middle school math produc
Subjects:
Grades:
7th - 9th
Types:
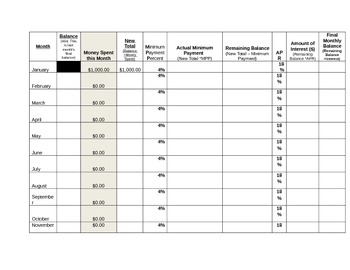
Real Life Math: Percents: Credit Card Debt Worksheet - Scenario # 2
The scenario on this chart is as follows:
"MasterCard sent you a fabulous new credit card offer in the mail. It is a special card for teens with really low minimum monthly payment percent of 4%. In exchange for the low minimum monthly payment percent, MasterCard raised your APR to 18%. You decide to use this credit card instead of the Visa in Scenario #1. Fill out the chart and determine the amount of money you spent and your remaining balance. "
The chart is a great way for students to di
Grades:
7th - 10th
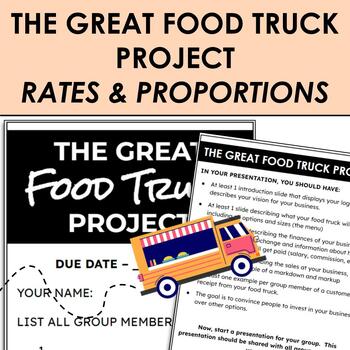
"The Great Food Truck Project" - Rate, Proportions, and Percents Unit Assessment
A rates and proportions unit project, centering around the real-world use of percentages and rates. Students work with a small group to create their own concept for a food truck, including what food and drink options they would sell. Using inspiration for "The Great Food Truck Race" and "Sharktank" TV shows, students work to create a best-selling idea, that also showcases their own values as a "company".I hope to share more information and examples of how I use this project with my upcoming ye
Subjects:
Grades:
6th - 8th
Scatterplots and Line of Best Fit
This engaging activity allows students to apply their knowledge of slope, scatterplot data, and line of best fit to figure out how tall Sasquatch is. Taking the role of engineers, students use a foot print of sasquatch to approximate his height which is needed to construct a trap. An engaging newspaper article sets the scene of the recent Sasquatch sightings at the local park. This activity is also available in a bundle at a discounted rate:Scatterplots and Line of Best Fit BundleAligned to C
Subjects:
Grades:
7th - 9th
Types:
Also included in: Line of Best Fit and Scatterplots: The Bundle
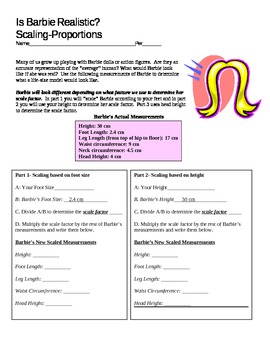
What would Barbie Look like if she were Real?
Ever wondered what Barbie would look like if she were real? Now you can work with your students to find out!
Part 3
In order to save you and your students time, I measured various segments of Barbie's actual doll measurements. Students can use their measurements from Parts 1 and 2 of the Human Body Proportion Lab (available on TCP) OR measure their height or foot size to determine the SCALE FACTOR between their body and the doll's body. Using the SF, students will determine Barbie's measure
Subjects:
Grades:
7th - 10th, Higher Education, Adult Education
Types:
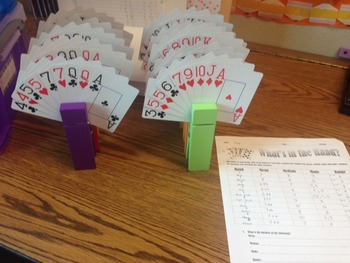
Statistics Mode, Median, Mean, Range Worksheet for Math or Psychology
What's in the Hand: Activity makes learning mode, median, mean, and range fun. You will need two packs of playing cards in order to use 10 different variations. I use giant clothes pins to hold a total of 9 cards for each station. Each student gets a worksheet and is assigned to a group of 4-5 students. Students will complete the first rotation by figuring the mean, median, mode, and range, and then rotate to each other station in about 5 min intervals. At the end they will answer the questions
Subjects:
Grades:
5th - 12th
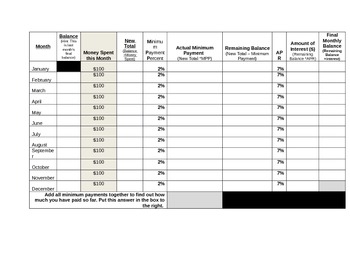
Percents: Understanding Credit Card Debt Worksheet for Students - Scenario 3
This chart covers the following scenario:
"Capital One offers a special credit card for teens. It has a spending limit of $100 per month and a very low monthly payment of 2%. The APR for this card is also pretty low at 7%. You talk to your parents and they agree that it sounds safe so they cosign the card with you. You now have your own credit card to use for monthly purchases and do not have to constantly ask your parents for money. You will owe your parents the remaining balance at the end
Grades:
7th - 10th
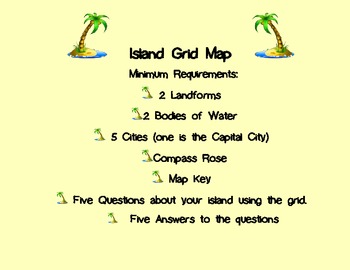
Grid Art Island Maps
Students demonstrate their knowledge of map skills by designing their own island and creating questions using the map grids. Students also practice their skills with the X-Y axis. Creativity is the key to generating excitement among your students in this interest based project!
Product download includes assignment page, question and answer documents, rubric, grid, and teaching tips on how I use this assignment in my 4th grade gifted cluster classroom.
Subjects:
Grades:
4th - 5th
Types:
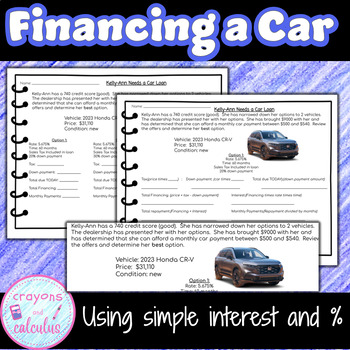
Buying a Car - Finance with Simple Interest
Taking out a loan for a car can be confusing. Students will help Kelly-Ann calculate tax, own payment, simple interest, and monthly loan payments. They will determine how much money will be needed the day of purchase and what different finance options will do to her monthly payments. There are 3 different options for 2 cars (6 total) for students to calculate loan repayments at rates and down payment needs and then they will finish up by comparing and deciding which option fits in Kelly-Ann's
Grades:
8th - 11th
Types:
CCSS:
You've Been Fired Simulation (Equations and Financial Literacy)
Includes: Checklist with Instructions, Career Survey, Budgeting Sheet. This is a project designed for 7th -12th grade. This project will challenge students to use their math knowledge to solve real-world problems and gain perspective about economic responsibilities. It involves career planning, budgeting per month, and dealing with adversity in adult life.
Subjects:
Grades:
7th - 11th
Types:
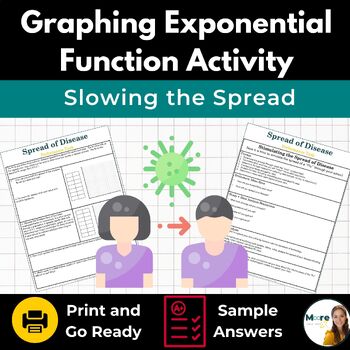
Graphing Exponential Functions Activity - Exponential Growth and Decay Activity
Slowing the Spread Exponential Function Performance Task – where real-life meets math in an engaging, in-class activity! Here's the scoop on Slowing the Spread: Real-World Modeling: Students explore various strategies to prevent the spread of viral diseases within a population. They flex their problem-solving muscles to determine how quickly the entire school could become infected. Simulate and Analyze: It's not just about theory – students take charge of simulating and slowing the spread of a
Grades:
10th - 11th
Types:
CCSS:
Also included in: Exponential Function Activity Bundle
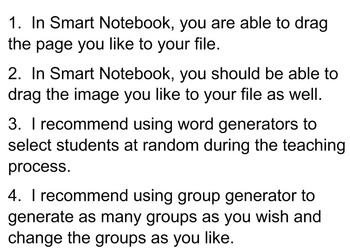
FREEBIE - Templates: Group Generator, Name Chooser, Timer, Activity, ... etc.
This Smart Notebook file contains tools that are helpful to use in managing the classroom. A "Group Generator" tool allows you to generate as many groups as you wish. A "Word Chooser" tool allows you to pick on a student for an answer at random. A "Timer" allows to manage your class time effectively. Different type of timers are also included such as firecracker. Also, for those who are teaching probability, an interactive die, spinner, and card are also available in this template file.
Si
Subjects:
Grades:
PreK - 12th, Higher Education, Adult Education, Staff
Types:

What would Barbie Look like if she were Real? Part 3 and 4 - Body Proportions
Ever wondered what Barbie would look like if she were real? Now you can work with your students to find out!
Part 3
In order to save you and your students time, I measured various segments of Barbie's actual doll measurements. Students can use their measurements from Parts 1 and 2 of the Human Body Proportion Lab (available on TCP) OR measure their height or foot size to determine the SCALE FACTOR between their body and the doll's body. Using the SF, students will determine Barbie's measure
Subjects:
Grades:
7th - 10th, Higher Education, Adult Education
Types:
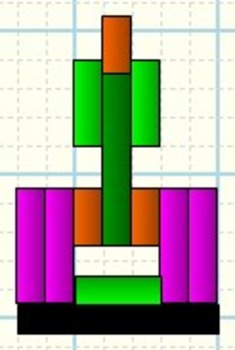
Cuisenaire Rods App
This software simulates the use of Cuisenaire Rods - the most precise math manipulatives ever devised. It supports our innovative
'Play Based Math for Preschool, Kindergarten and Grades 1 Through 3' (available on TPT) but can be used as a stand alone app for children or as a whiteboard accessory.
To view the video demonstration visit:
https://www.youtube.com/watch?v=-wCZkk4ifCU
Currently it is only available for Windows but a Mac version is being developed.
Subjects:
Grades:
PreK - 4th, Staff
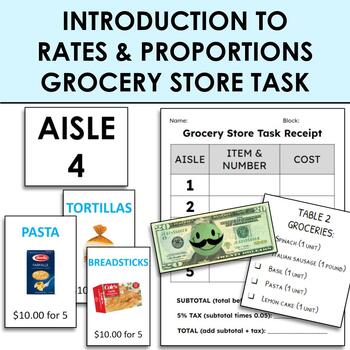
Introduction to Rates and Proportions - Grocery Store Task
This activity is designed to introduce students to the concept of rates and unit rates, through a simulation-style grocery store activity. With a small group, students are given a grocery list, a “$20 bill”, and open access to five “grocery store aisles”. Students will travel the aisles with their “families” while shopping for their dinner ingredients. They have only $20 to spend, so they must find how much only 1 unit of each item costs, as they do not want to overspend. Using their receipt
Subjects:
Grades:
6th - 8th
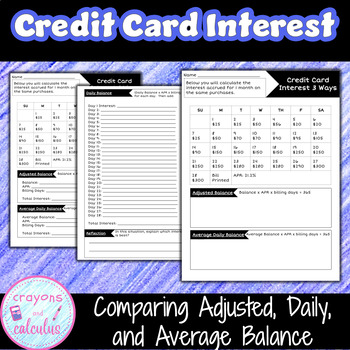
Calculating Credit Car Interest 3 Ways
Calculating interest on credit card purchases can be overwhelming, especially for students who are new to managing finances. This activity provides an opportunity for students to explore the different ways interest can be calculated on a credit card balance. By reviewing daily balances for a month and calculating interest for the same balances using daily, daily average and previous balance methods, students can gain a better understanding of how interest is calculated for credit card purchases.
Grades:
8th - 11th
Types:
CCSS:
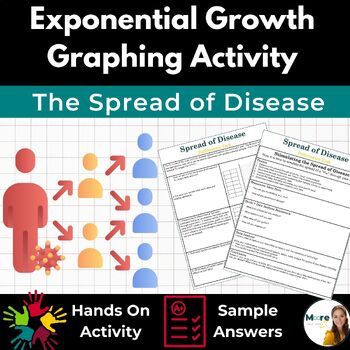
Exponential Growth Activity - Writing and Graphing with Exponential Functions
welcome the era of hands-on learning with our Spread of Disease Exponential Growth Activity! Prepare for a math journey like never before, as your students dive into this common core aligned performance task that transforms abstract concepts into real-world solutions.Here's the inside scoop on the Spread of Disease: Real-Life Modeling: This isn't your average performance task – it's a dynamic exploration of how viral diseases spread through a population. Students roll up their sleeves to solve t
Grades:
10th - 11th
Types:
CCSS:
Also included in: Exponential Function Activity Bundle
Exponential Decay
This engaging activity helps students visualize the concept of exponential decay. Through a zombie apocalypse simulation, students collect and record data. The data is then graphed and compared to linear data. Finally, the equation for exponential decay is shared and students are given a some real life scenarios to apply the formula and concept to.
Please leave feedback on this product. You can earn TpT credits for future purchases.
Check out these similar products:
Line of Best Fit:
Subjects:
Grades:
8th - 10th
Types:
CCSS:
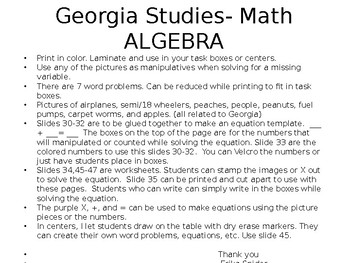
Using Variables in Math- Special Education
This activity is designed for the visual needs of special education students. The pictures relate to Georgia but can be used in other states. There are pictures, numbers, word problems, and 3 leveled worksheets Low, Medium, High. We use this in centers, as whole group, small group etc. The concept is using variables in math at its most simplistic level. This an editable powerpoint.
Subjects:
Grades:
2nd - 8th
Types:
Systems of Equations: Finding Buried Treasure with Solutions
This engaging activity gives students the opportunity to practice graphing and solving systems of equations in a fun way. Students work to find 3 "buried treasures" based on information they are given about people walking or riding to meet at the buried treasure location. Graphing lines, writing equations for lines, and finding solutions to systems of equations are all skills they will practice with this activity. Answer keys included.
Please leave feedback and if you like this product con
Grades:
7th - 9th
Types:
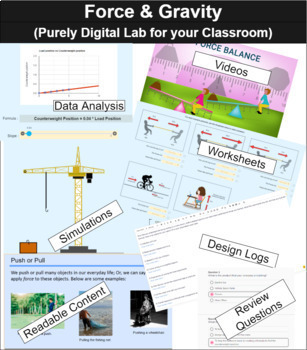
Force Balance - Understanding Force & Gravity :Purely Digital Lab for Classrooms
This ActiveLearningLabs Lab is a purely digital two-day (one hour per day) STEM lab in which students will engage in a real-life situation and master the concepts of Force and Gravity to solve a real-world problem.With a single license, you can run the lab for up to 5 classrooms. Before purchasing the lab, click on this link to run the lab for yourself without needing to create an account - https://activelearninglabs.com/lab-details/ed2b3bc5-f6d4-4a0c-a745-32fa29a2b6e9?source=tpt and click on "P
Subjects:
Grades:
6th - 8th
Types:
NGSS:
MS-ETS1-4
, MS-PS2-2
, MS-ETS1-1
, MS-ETS1-3
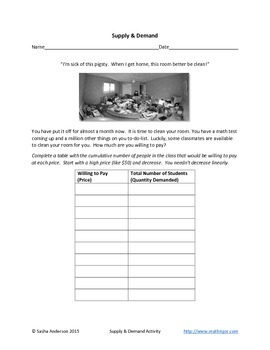
Supply and demand
A classroom activity where student build their own demand and supply curves based on what they are willing to pay (or be paid) for a clean room. Students must reason quantitatively and use units common in economics to solve problems in market equilibrium. Algebra- linear equations, systems of equations, and functions.
Subjects:
Grades:
9th - 12th, Higher Education, Adult Education
Types:
CCSS:
Showing 1-24 of 31 results


