TPT
Total:
$0.00

"The Great Food Truck Project" - Rate, Proportions, and Percents Unit Assessment

;
Mollie's Room
36 Followers
Grade Levels
6th - 8th, Homeschool
Standards
Formats Included
  • PPTX
Pages
14 pages
$10.00
$10.00
Share this resource
Report this resource to TPT
Mollie's Room
36 Followers

Description

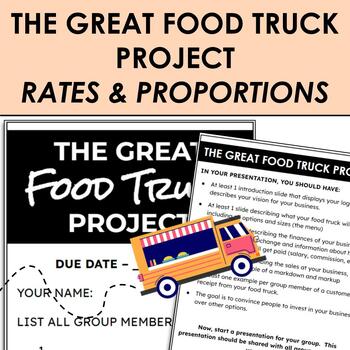
A rates and proportions unit project, centering around the real-world use of percentages and rates. Students work with a small group to create their own concept for a food truck, including what food and drink options they would sell. Using inspiration for "The Great Food Truck Race" and "Sharktank" TV shows, students work to create a best-selling idea, that also showcases their own values as a "company".


I hope to share more information and examples of how I use this project with my upcoming year of students, but please reach out to me with comments or questions about how to use this project as a culmination of the rates and proportions unit.  I typically use this as an assessment on the percents part of the unit, as it creates a real-world scenario for students to immerse themselves in and get creative with.

Total Pages
14 pages
Answer Key
Included with rubric
Teaching Duration
N/A
Report this resource to TPT
Reported resources will be reviewed by our team. Report this resource to let us know if this resource violates TPT’s content guidelines.

Standards

to see state-specific standards (only available in the US).
Compute unit rates associated with ratios of fractions, including ratios of lengths, areas and other quantities measured in like or different units. For example, if a person walks 1/2 mile in each 1/4 hour, compute the unit rate as the complex fraction ½/¼ miles per hour, equivalently 2 miles per hour.
Recognize and represent proportional relationships between quantities.
Decide whether two quantities are in a proportional relationship, e.g., by testing for equivalent ratios in a table or graphing on a coordinate plane and observing whether the graph is a straight line through the origin.
Identify the constant of proportionality (unit rate) in tables, graphs, equations, diagrams, and verbal descriptions of proportional relationships.
Represent proportional relationships by equations. For example, if total cost 𝘵 is proportional to the number 𝘯 of items purchased at a constant price 𝘱, the relationship between the total cost and the number of items can be expressed as 𝘵 = 𝘱𝘯.

Reviews

Questions & Answers

36 Followers