74 results
Middle school statistics activboard activities for GATE
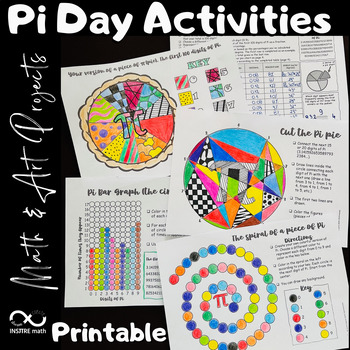
4 Pi Day Math Activities | Math & Art Projects | Coloring Circles | Pie Chart
4 Math & Art Projects to celebrate Pi Day that include circles and Pi exploration! Your students will love these Pi Day activities! Let your students express themselves using these hands-on Math & Art resources during the exploration of Pi.Content:- Your version of a piece of π (pie). The first 100 digits of Pi. Frequency Pie Chart.- Pi Bar Graph - the circular version.- The spiral of a piece of Pi.- Cut the Pi pie.This resource includes:- The editable PowerPoint™ version.- The printable
Subjects:
Grades:
4th - 8th
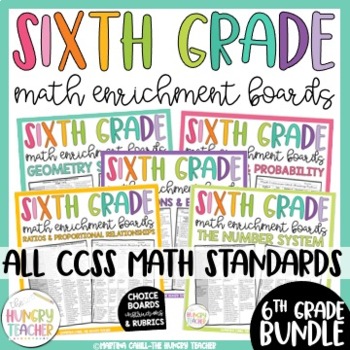
Math Enrichment Choice Board Sixth Grade for Ratios Statistics Number System
This resource includes math enrichment choice boards, rubrics, and instructions for every single 6th grade math Common Core State Standard for ratios, proportional relationships, expressions and equations, statistics and probability, geometry, and the number system. These are great for early finishers and students who need enrichment in math. Included in this pack are the math enrichment boards I use for my sixth grade learners who have mastered any of our math concepts and are now ready for a c
12 Days of Christmas: A Computer Spreadsheet Activity
This great holiday activity shows students how to use a computer spreadsheet to calculate the cost of their true love's gifts in today's dollars.The simple step-by-step procedure will allow both beginning and computer-savvy students to experience success as they learn how to use spreadsheet software. Students will enjoy the engaging and entertaining activity. No computer? No problem! Use the activity master so students can calculate the costs themselves.
Grades:
5th - 9th
Types:

Statistics Survey Project - Project Based Learning (PBL) with Math
Watch your students dive into the world of math as they create, execute, and analyze their own survey! Students will demonstrate mastery of data gathering, survey sampling, developing appropriate survey questions, data tables, Direct Variation, discrete graphs, dot plots, box and whisker graphs, and calculating the inter-quartile range.The Unique Survey Project is highly engaging, capitalizing on the innate curiosity of the adolescent mind. You will love the low-prep instructional guide. Your st
Subjects:
Grades:
6th - 10th
Types:
Also included in: Fun with Ratios Activities Bundle - 7th Grade PBL with Math
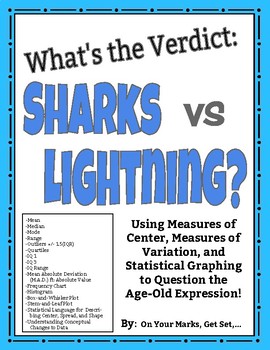
What's the Verdict: Sharks vs. Lightning? Modes of Center, Spread, and More!
Put it to the test! Use the age-old expression: "You are more likely to get struck by lightning than to be bitten by a shark!" to learn and practice Measures of Center, Measures of Spread, Measures of Shape, and Statistical Graphing including:MEANMEDIANMODERANGEOUTLIERS [Using IQR +/- 1.5(IQR)]QUARTILES [lower quartile (IQ-1) and upper quartile (IQ-3)]INTERQUARTILE RANGE (IQR)MEAN ABSOLUTE DEVIATION/ M.A.D. ft. ABSOLUTE VALUESYMMETRY/ASYMMETRY OF DISTRIBUTIONCLUSTERS AND GAPSBELL SHAPED CURVE AN
Subjects:
Grades:
5th - 12th, Higher Education, Adult Education
Types:
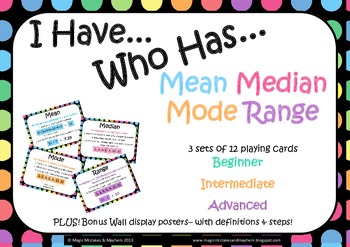
Mean, Median, Mode, Range "I Have Who Has" Game
A GREAT, FUN WAY FOR KIDS TO PRACTICE AND REINFORCE THEIR SKILLS IN THIS TRICKY TO REMEMBER AREA!3 DIFFERENT LEVELS! This pack includes 36 cards for the game "I Have Who Has" with a focus on Mean, Median, Mode and Range. The cards are split into three levels to be played in small groupsBeginner (green cards)Intermediate (orange cards)Advanced (purple cards)The aim of the game is to quickly work out the problem on your card so that when some one asks "who has...." if it is you then you can answe
Subjects:
Grades:
4th - 7th
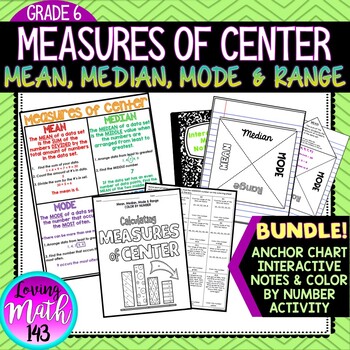
Mean Median Mode and Range Interactive Notes, Poster and Activity BUNDLE
Mean, Median, Mode & Range Color By Number ActivityThis color by number activity is a fun and engaging way for students to practice calculating the measures of center including mean, median, mode and range. Students will solve 16 questions involving mean, median mode, and range then find their answer on the color by number sheet. If their answer is not on the color by number then their answer is not correct. This activity is aligned with the sixth (6th) grade common core standards.WHATS INCL
Subjects:
Grades:
5th - 8th
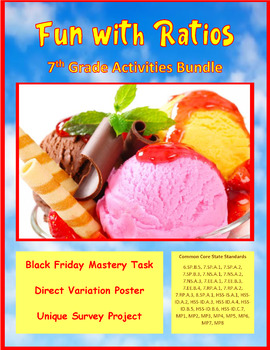
Fun with Ratios Activities Bundle - 7th Grade PBL with Math
The purpose of the Fun with Ratios Activities Bundle is to give students the opportunity to use creativity to apply ratios, proportions, and percentages in real-world settings. This bundle includes three unique tasks: Black Friday Mastery Task, Direct Variation Poster Mastery Task, and the Unique Survey Project. These activities and their accompanying materials are suited for students in grades 7 through 9. These lessons make excellent sub plans. Each project takes approximately two 60-minute bl
Subjects:
Grades:
7th - 9th
Types:
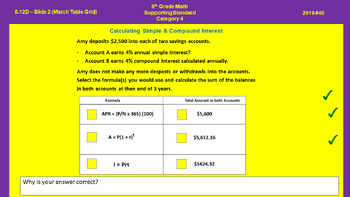
Math Jam Interactive Slides - 8th Gr Cate 4
Jamboard slides aligned to Math STAAR Release problems and new items types that include Equation Editor, Text Entry, Graphing, Number Line, Hot Spot, Fraction Model, Drag n Drop, Match Table Grid and Multiselect. Resource can be used to expose students to the new item types on the STAAR Redesign math assessment.
Subjects:
Grades:
8th
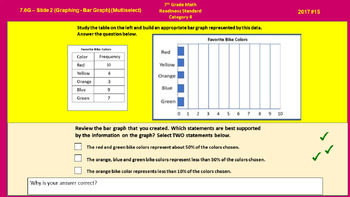
Math Jam Interactive Slides - 7th Grade Cate 4
Jamboard slides aligned to Math STAAR Release problems and new items types that include Equation Editor, Text Entry, Graphing, Number Line, Hot Spot, Fraction Model, Drag n Drop, Match Table Grid and Multiselect. Resource can be used to expose students to the new item types on the STAAR Redesign math assessment.
Subjects:
Grades:
7th
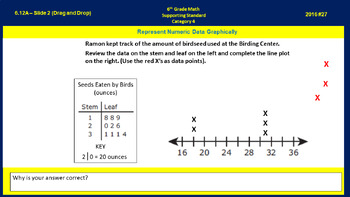
Math Jam Interactive Slides - 6th Gr Cate 4
Jamboard slides aligned to Math STAAR Release problems and new items types that include Equation Editor, Text Entry, Graphing, Number Line, Hot Spot, Fraction Model, Drag n Drop, Match Table Grid and Multiselect. Resource can be used to expose students to the new item types on the STAAR Redesign math assessment.
Subjects:
Grades:
6th
Types:
Categorical Data vs Numerical Data Flip Chart
In this flip chart, students will learn the difference between categorical data and numerical data, examples, and key vocabulary. The activinspire flip chart allows the teacher to reveal the information by removing the shapes over the correct information. At the end of the lesson are five questions which the students have to classify as categorical or numerical.
Grades:
5th - 8th
Types:

Statistics animated powerpoint lesson template
Content:1.Introduction2.Discrete Data3.Continuous Data4.Central Tendancy of a Data Set5.Range and Interquartile Range6.Box and Whisker Plot
Subjects:
Grades:
8th - 9th

Statistics animated powerpoint template lesson part 1
Statistics animated lesson:content:1.Introduction2.Discrete Data3.Continuous Data4.Central Tendancy of a Data Set
Subjects:
Grades:
8th - 9th
Also included in: Statistics animated powerpoint lesson template
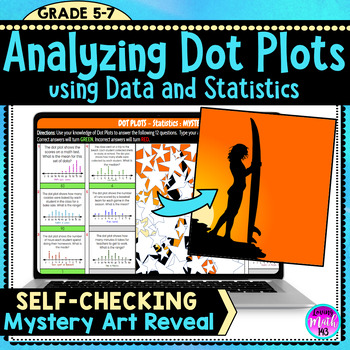
Analyzing Dot Plots using Data and Statistics Fun Digital Mystery Art Reveal
This Digital Self-Checking Math Activity allows middle school students to practice analyzing dot plots using data and statistics. Students will apply their understanding of line plots, mean, median, mode and range. Each correct will reveal part of a fun Mystery Picture! Great resource as independent practice or homework.This is a perfect activity to check for understanding of probability and statistics during distance learning and students using Google Classroom™. You can share this activity wit
Subjects:
Grades:
6th - 7th

Statistics animated powerpoint lesson template part 2
Statistics part 2:1.Range and Interquartile Range2.Box and Whisker Plot
Subjects:
Grades:
8th - 9th
Also included in: Statistics animated powerpoint lesson template
Fundamental Counting Principle and Probability Powerpoint
This 22 slide powerpoint is a great way to teach Tree Diagrams, The Fundamental Counting Principle, and Probability to your Middle Schools Students. It can be used with a smartboard to get your students active and involved or without a smartboard.
Subjects:
Grades:
6th - 8th, Adult Education
Which Graph Do I Use to Display Data? Flip Chart
This review of various graphs indicates which graph is best to use for certain types of data. At the end, there is a 10 question multiple choice activote activity where the students are given a situation and have to choose the correct graph to display their data.
Subjects:
Grades:
4th - 8th
Types:
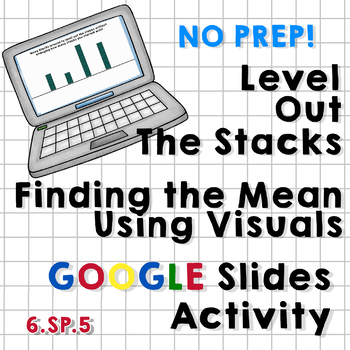
Level Out the Stacks - Finding Mean Using Visuals - Google Slides Activity
This Google Slides Activity includes 25 unique slides that help students to find the mean of a set of data using visuals first (stacks of blocks of varying heights), then eventually proving their answer by performing the actual calculations.
The slides become moderately more difficult as students progress through the activity, ending with several decimal problems where the cubes they're working with are split into fourths and the calculated mean is a decimal.
The slides are easy to duplicate
Subjects:
Grades:
5th - 7th
Types:
CCSS:
Probability Independent and Dependent Events Activity Paper Chain
Engage students at centers or in partners with this Probability Independent and Dependent Events Paper Chain Activity. Students solve probability questions involving tables, word problems, and diagrams. One link which leads to the answer on the next link. My students LOVE this activity. This resource includes:- Paper chain links with Probability problems- Answer key- Teacher's guide.A great addition to your middle school math curriculum and for differentiation.Also available in money-saving
Subjects:
Grades:
7th - 9th
Types:
CCSS:
Also included in: 7th Grade Math Activities Paper Chains Bundle
Math Escape Room For 11th and 12th Grade
If you are looking for a Math detective based team-building activity challenge to keep your students engaged with revision and learning about this topic, then this EDUCATIONAL ESCAPE ROOM is for you! There are seven detective inspired - but subject themed (trivia) challenges included in this file. Students will complete a variety of tasks using different skills including: problem-solving, critical thinking, reading comprehension, literacy challenges and some clever deduction. The puzzles, bonus
Subjects:
Grades:
7th - 12th
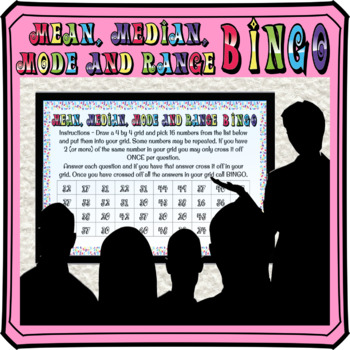
Mean, Median, Mode and Range math BINGO
This mean, median, mode and range activity is a really fun way for students to practice. Skills include finding the mean, median, mode or range from a list of numbers. All give positive integer answers.Show the questions on a Smart Board or projector. Your students will love it and won't realize how many questions they are answering!This product includes:★ A PowerPoint display with instructions, student choice bingo numbers and 40 questions★All 40 numbers on screen for students to make their own
Subjects:
Grades:
5th - 8th
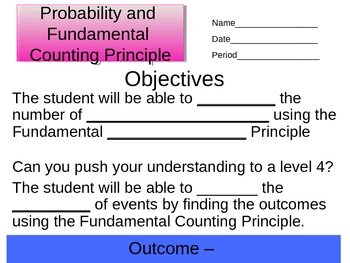
Fundamental Counting Principle and Probability Student Notes Powerpoint
This 18 slide powerpoint goes with my Fundamental Counting Principle, and Probability Powerpoint. You can print a handout of these slides with the blanked out key information for students to use to take notes as they follow along with the presentation.
Subjects:
Grades:
6th - 8th, Adult Education
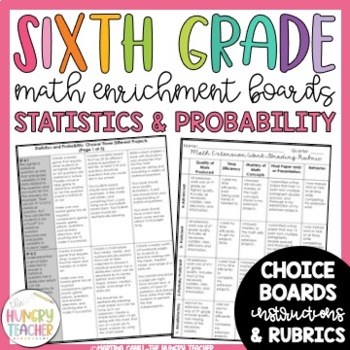
Math Enrichment Board for Statistics and Probability Sixth Grade | Choice Board
Included in this pack is the sixth grade math enrichment boards I use for my sixth grade learners who have mastered any of our statistics and probability math concepts and are now ready for a challenge. These choice boards give students choice, ownership, and a challenge through focused standard based projects. Included in this pack are the math enrichment boards I use for my sixth grade learners who have mastered Statistics and Probability concepts and are now ready for a challenge. There are t
Subjects:
Grades:
6th
Types:
Showing 1-24 of 74 results


