9 results
Common Core 6.SP.B.5a resources for GATE
Football Stats Math Project - Upper Elementary Math: Graphing and Analyzing Data
This Football Stats Project incorporates the use of line plots, stem and leaf plots, analyzing upward and downward trends in data and median, mode, range and outliers. I also incorporated discussion and higher order thinking skills. Students will apply these concepts and skills to football statistics that they will research - included are suggestions for websites to research and topics to research.This would be best for 4th, 5th or 6th grade math students.This resource includes slides that intro
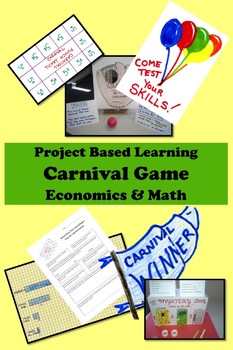
Carnival Game Economics PBL Project-Based Learning GATE
Smaller tasks add up to big, big learning with this gold medal standard project-based learning activity! What a sneaky cool way to learn math, economics, and functional design! (Insert evil teacher laugh.) It’s a hands-on approach to Common Core Standards.
In Carnival Game Economics, students design a carnival skill game and gather data as junior market researchers during the test phase. They’ll use this data to help make decisions. After making calculations for probability, students will
Subjects:
Grades:
4th - 7th
Types:
Also included in: Gifted and Talented SURVIVAL KIT Bundle -- 235 pages, big discount!
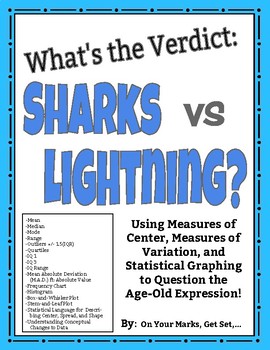
What's the Verdict: Sharks vs. Lightning? Modes of Center, Spread, and More!
Put it to the test! Use the age-old expression: "You are more likely to get struck by lightning than to be bitten by a shark!" to learn and practice Measures of Center, Measures of Spread, Measures of Shape, and Statistical Graphing including:MEANMEDIANMODERANGEOUTLIERS [Using IQR +/- 1.5(IQR)]QUARTILES [lower quartile (IQ-1) and upper quartile (IQ-3)]INTERQUARTILE RANGE (IQR)MEAN ABSOLUTE DEVIATION/ M.A.D. ft. ABSOLUTE VALUESYMMETRY/ASYMMETRY OF DISTRIBUTIONCLUSTERS AND GAPSBELL SHAPED CURVE AN
Subjects:
Grades:
5th - 12th, Higher Education, Adult Education
Types:
Take Me Out to the Ballgame: Baseball Math Enrichment Project
This is a real world enrichment project for those students who need some deeper work in mathematics. Students will use a variety of skills to complete this project including, research skills, elapsed time skills, measurement skills, and higher level thinking skills. This is a great way to provide differentiation in the classroom. There is a 3rd/4th grade packet and a 5th/6th grade packet included. This is great for gifted and talented students. It also can be a great family activity to work
Subjects:
Grades:
3rd - 6th
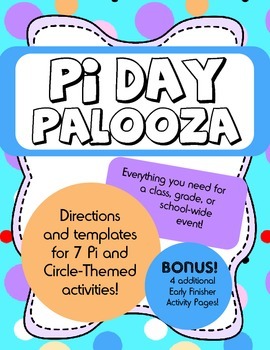
Pi Day Palooza! Activities and Centers
Miss Challenge's Pi Day Palooza! This 25-page set includes 7 (yes, 7!) centers, complete with specific directions, templates, and resources. Celebrate such a valuable number on its special holiday (3/14) or any day of the year! The set reaches all learners with many different content areas covered, including Language Arts, Theater, Art, and Math.
Circle Logs
Pi Poetry
Pi Performance
Pi Plate
Pi Probability
Circle Hunt
Checkers
Subjects:
Grades:
5th - 8th
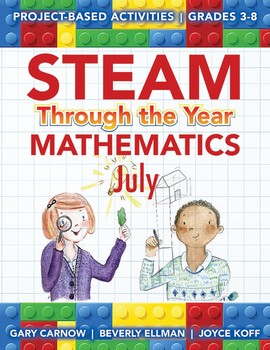
STEAM Through the Year: Mathematics – July Edition
STEAM Through the Year: Mathematics for July guides you through the month with STEAM lessons and projects. Students build mathematical proficiency with monthly-thematic lessons correlated to the National Council of Teachers of Mathematics standards. Here you will find easy-to-use lessons providing practical strategies and problem-solving activities. The math and poetry lessons are themed around July special days and holidays – National Picnic Month, Fourth of July, Math 2.0 Day and Moon Day. Stu
Subjects:
Grades:
1st - 6th, Not Grade Specific
Types:
✏️ Statistics & Probability Performance Tasks
There are 4 separate performance tasks in this Google Drive Folder! You can work on them with your students, have them work in groups, or give it as an assessment! These are great problems that ensure even greater classroom conversations!
Subjects:
Grades:
6th - 8th
Types:
Also included in: ✏️ 6th Math Performance Task BUNDLE
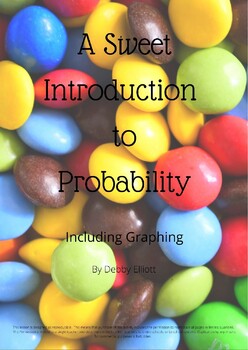
A Sweet Introduction to Probability
Students will be introduced to probability and graphing including:1) Making a bar graph2) Making a circle graph3) Making a line graph4) Forming a fraction based on data5) Convert a fraction to a decimal and percent6) Learn how to find the mean, median, and mode for average7) State the probability of finding a yellow candy in a bag
Subjects:
Grades:
6th
Types:
6th Grade Mathematics Assessment
This is an assessment that mimics the look and feel of an AP Exam, but it is much shorter (can be administered in 45 minutes). This test assesses Sixth Grade Common Core Mathematics Standards. This assessment is designed to prepare students for future AP courses and exams. An answer key w/rubric and CCSS alignment is included. If you like the format of the exam, a blank copy is now available in MS WORD so that you can create your own assessments for any grade level mathematics course.
Subjects:
Grades:
6th
Types:
Showing 1-9 of 9 results

