308 results
7th grade graphing printable microsofts
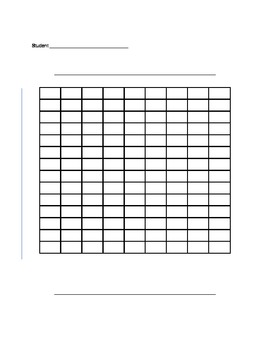
Blank Bar Graph/Double Bar Graph Template
This is a bar graph template that can be used by teachers to teach students how to understand bar graphs and create their own bar graphs. Teachers can use this template teach students about parts of a bar graph and how to interpret data in bar graphs.
Grades:
1st - 12th
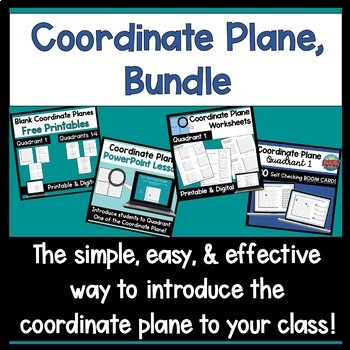
Coordinate Grid Quadrant 1 Bundle
This bundle deals mostly with quadrant one of the coordinate plane.The resources include:Free Blank coordinate planes/coordinate grids in printable and digital formatsIntroduction to Coordinate Graphing PowerPointPrintable & Digital Coordinate Plane Quadrant 1 WorksheetsCoordinate Plane Quadrant 1 Boom CardsBuy these in the bundle to get them at 30% off!*While the title says "Quadrant 1 Bundle," the printable worksheets include one page on quadrants 1-4 and the digital worksheets include thr
Grades:
5th - 7th
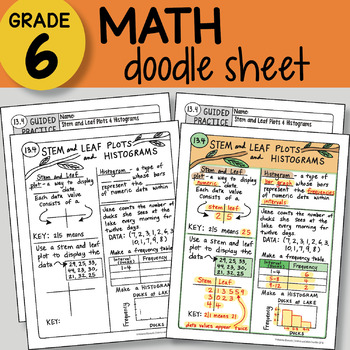
Math Doodle - Stem and Leaf Plots & Histograms - EASY to Use Notes - PPT!
INCLUDED in this download:Math Doodle SheetGuided Practice Sheet PowerPoint – to show students the KEY– two versions of both sheets included: INB and large 8.5 x 11 sizeTEKS and CC Aligned – plan for the FULL year includedThis download is part of a larger bundle of 68 Doodle Sheets found here: 6th Grade Math ALL the DOODLE Sheets ~ So Fun and Engaging!These 6th grade math doodle sheets are a great way to help the students learn math concepts! Students are engaged as they take creative notes and
Subjects:
Grades:
5th - 7th
Graph Points on the Coordinate Plane (PowerPoint Only) - Distance Learning
This is an awesome PowerPoint that will have your kids accurately graphing points on the coordinate plane in no time.PowerPointThe entertaining, interactive, and easy-to-understand 17-slide PowerPoint walks learners through:-The development of the coordinate plane-Basic graphing and coordinate plane terminology: x-axis, y-axis, ordered pair, coordinates, origin, quadrant, etc.-Plotting point demonstrations-Various plotting points practice (three slides)These embedded practice problems are essent
Subjects:
Grades:
5th - 7th
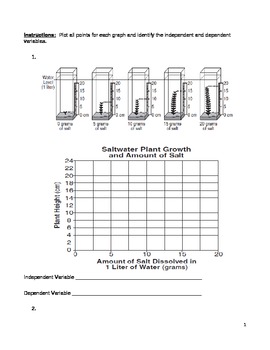
Middle School Math and Science Graphing Practice - Middle School Line Graphs
Use this resource to help your middle school math and science students learn and practice how to make line graphs as well as identify the independent and dependent variables. Move beyond bar graphs! There is a teacher key provided and eight graphs for practice.
line graph, plot points, x-axis, y-axis, independent variable, dependent variable
Subjects:
Grades:
5th - 9th
Types:
Create Population Pyramids!
OverviewStudents will understand how to read a population pyramid by creating one! This activity includes two templates to help your students create their own population pyramids, as well as population data for four countries from the U.S. Census Bureau's International Database. The activity includes blank cards if you or your students would like to create additional or specific population pyramids. Instructions are included to help navigate the U.S. Census Bureau's website in order to obtain th
Grades:
6th - 12th
Types:
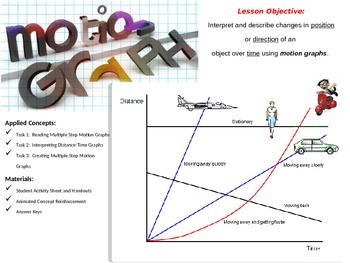
Motion Graphs
Lesson Objective:
Interpret and describe changes in position or direction of an object over time using motion graphs.
Types of Graphs Included in Lesson:
Distance/Time
Position/Time
Applied Concepts:
Task 1: Reading Multiple Step Motion Graphs
Task 2: Interpreting Distance-Time Graphs
Task 3: Creating Multiple Step Motion Graphs
Materials:
Student Activity Sheet and Handouts
Animated Concept Reinforcement
Answer Keys
*This lesson is not intended to be used as an introduction to Distanc
Subjects:
Grades:
6th - 8th
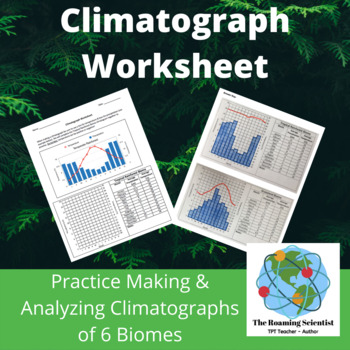
Printable Climatograph Worksheet
This comparative biome graphing worksheet asks students to create and analyze six climatographs for six of Earth’s major terrestrial biomes. Help your students develop graphing skills including drawing bar graphs, line graphs, dual y-axis graphs and interpreting data.This climatograph activity can be used as a lesson, homework assignment, it can be used in small groups or individually or as a revision activity. This is also an excellent substitute teacher lesson. This activity is easily modifiab
Subjects:
Grades:
6th - 12th
Types:
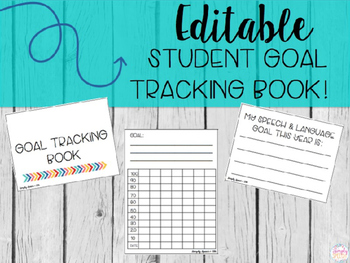
Editable Student Goal Tracking Book
These mini goal books are the perfect way to help your students keep track of their own goals. These books help increase student motivation and self awareness as they create their own personal goals and track their own progress.Here's what's included:Page 3: cover page options. This page is editable. Click on 'add text box' to add your students' names to their books.Page 4: Goal tracking sheets. Print as many of these pages as you need. This is also editable if you wish to type the goals in. Pag
Subjects:
Grades:
1st - 12th
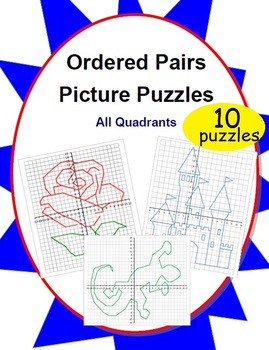
10 Ordered Pairs Mystery Picture Puzzles (All Quadrants)
10 original pictures perfect for any order pair puzzler. Start simple with a continuous connect-the-dot picture and graduate to more complex pictures composed of multiple sections. The built-in self-checking nature of creating a picture makes it easy for students to immediately assess their own progress.This 15-page PDF file includes:- 10 reproduction-ready original picture puzzles- An illustrated key so teachers can select appropriate puzzles based on student skill level and intended use- Numbe
Grades:
4th - 10th
Types:
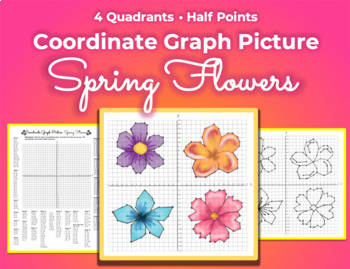
Coordinate Graph Picture: Flowers
SPRING IS ALMOST HERE! Keep your kids nice and busy with these lovely spring flowers. There are a lot of half points, so it'll require some concentration. BONUS - this doubles as a coloring sheet when they're done. :D Note to teacher: Each flower is in its own quadrant. You can assign more or less depending on ability. Quadrant I = Shapes 1-8Quadrant II = Shapes 9-12Quadrant III = Shapes 13-16 (plus the lines) Quadrant IV = Shapes 17-23 search terms: coordinate graph graphing picture drawing spr
Grades:
4th - 8th
Types:
5th Grade Geometry CCSS (Bundled PowerPoint Pack)
5th Grade Geometry - These are fun, very interactive PowerPoints that will help your students understand how to graph points on the coordinate plane and classify two-dimensional figures (polygons, triangles, quadrilaterals, etc.).PowerPoint #1 - Classifying Two-Dimensional Figures (20 slides):-Orientation/Vocabulary/Introduction to Polygons-Classifying Triangles (acute, right, obtuse, isosceles, equilateral, and scalene)-Classifying Quadrilaterals (regular and irregular, trapezoids, parallelogr
Grades:
4th - 7th
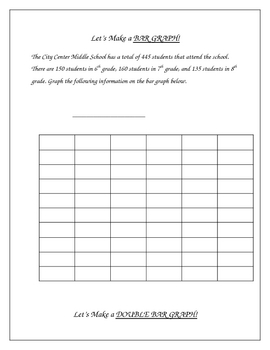
Constructing Graphs - Bar Graphs, Line Graphs, Circle Graphs
**I revised the numbers in the pie graph on this from the first version, these amounts are much more friendly** This activity includes construction of a bar graph, double bar graph, line graph, double line graph, and a circle graph.I put this together after being frustrated about not being able to find any graphing activities appropriate for intermediate grades that would allow me to make graphs with the class on my smartboard. I needed some examples to demonstrate how to take data and create a
Subjects:
Grades:
3rd - 10th, Adult Education
Types:
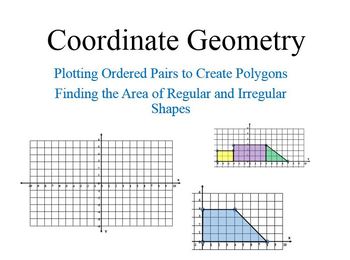
Coordinate Geometry and Finding Area by Decomposing Shapes
This product targets three Common Core standards. The main lesson includes 12 problems. Students plot and connect points on the coordinate axes. Then students find the area of the shapes they create. The lesson has a nice progression from simple rectangles and triangles to irregular polygons that must be decomposed into rectangles and triangles.
If you are looking for a lesson that combines many skills, then this is a great resource for you. Students plot ordered pairs in all 4 quadrants.
Subjects:
Grades:
6th - 7th

Stars and Constellations PowerPoint & Coordinate Plane Graphing Pictures Bundle
This Bundle includes:Graphing the Constellations: Coordinate Graphing - My Best SellerThis activity integrates Math and Science by teaching students about coordinate graphing as well as the constellations! The constellations are precisely positioned so that their positions match that of their actual positions in the sky! This can even be used as a constellation star map!Stars and Constellations PowerPoint: Galaxies, Nebulas, and Greek MythologyStop getting lost looking for stars & constellat
Subjects:
Grades:
4th - 9th
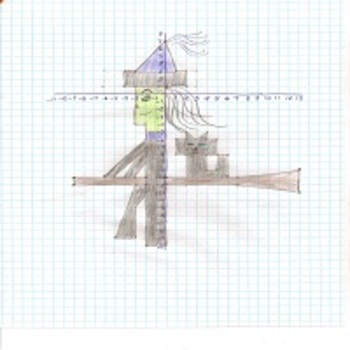
Halloween Designs: Creating Mystery Pictures With Coordinate Geometry
Students will create Halloween designs with this coordinate geometry activity. Have students create their own designs on a coordinate grid, using a Halloween theme. Students will practice plotting points, identifying coordinates on a grid, labeling a coordinate grid etc. I have included:-2 Student printable sheets (one asks students to create a basic design; the second also requires students to translate, rotate or reflect the design)-5 mystery Halloween designs that my students have created -th
Subjects:
Grades:
6th - 8th
Types:
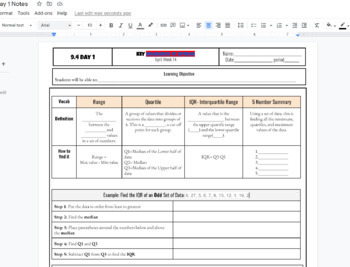
IQR interquartile Range and 5 number summary box and whisker plot Notes
IQR interquartile Range and 5 number summary box and whisker plot Notes including Q1, Q2, Q3, Min and Max and step by step both examples of finding the IQR and creating a box and whisker plot. Used in HS math 1 class WITH KEY INCLUDED AS a link to a printable PDF
Subjects:
Grades:
7th - 12th, Higher Education, Adult Education
CCSS:
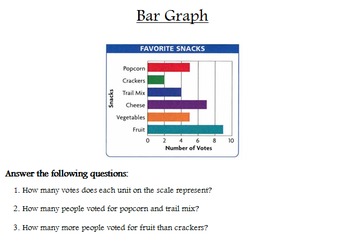
Interpreting Graphs Posters (Line Plot, Bar Graph, Line Graph, Etc)
Students practice interpreting several types of different graphs including line plot, bar graph, line graph, pictograph, double line graph, histogram, circle graph, and stem-and-leaf plot. Poster size sheets, so you can have students rotate in small groups or use in a math center. Answer key is included. I have a free graphic organizer that you can download that will help students learn about the different types of graphs first. Check it out!
Grades:
3rd - 7th
Types:
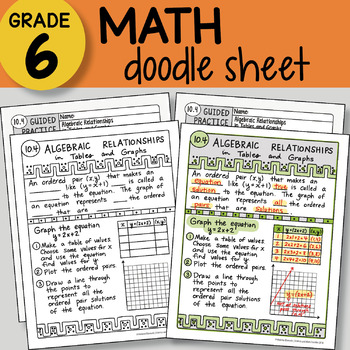
Math Doodle - Algebraic Relationships in Tables and Graphs - EASY to Use Notes
INCLUDED in this download:Math Doodle SheetGuided Practice Sheet PowerPoint – to show students the KEY– two versions of both sheets included: INB and large 8.5 x 11 sizeTEKS and CC Aligned – plan for the FULL year includedThis download is part of a larger bundle of 68 Doodle Sheets found here: 6th Grade Math ALL the DOODLE Sheets ~ So Fun and Engaging!These 6th grade math doodle sheets are a great way to help the students learn math concepts! Students are engaged as they take creative notes and
Grades:
5th - 7th
Graphing Marine Litter Decomposition Data Interpretation Middle School Practice
Graphing activity with reading passage. Learn to interpret data, create intervals, labels and plot points on graph paper and later on a computer. The real world data involves looking the rates of decomposition for different types of ocean litter or marine debris. Students read a three page passage about marine litter and decomposition and then draw a bar graph. They answer questions about trends they see about the relationship between food products and Phosphate runoff. No prep. Great for indep
Subjects:
Grades:
5th - 8th
Types:
NGSS:
MS-LS2-4
, MS-LS2-1
Graphing Agricultural Run Off Data Interpretation Middle School Practice Reading
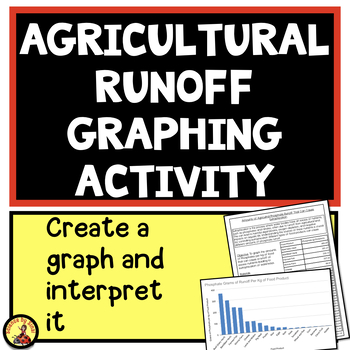
Graphing activity with reading passage. Learn to interpret data, create intervals, labels and plot points on graph paper and later on a computer. The real world data involves looking at the levels of agricultural Phosphate runoff, caused by a variety of different food products, that can cause eutrophication in local waterways. Students read a two page passage about eutrophication and then draw a bar graph. They answer questions about trends they see about the relationship between food products a
Subjects:
Grades:
5th - 8th
Types:
NGSS:
MS-LS2-4
, MS-LS2-1
Graphing on the Coordinate Plane (on a US Map with State Capitals!)
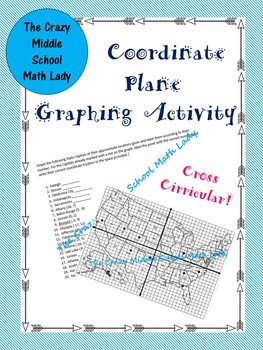
Help your students learn or review graphing on the coordinate plane by using US State Capitals to guide them! 20 US Capitals to graph or locate coordinates for. Answer Key provided. Also check off the box for cross curricular for math & social studies!
Grades:
6th - 9th
Types:
Learning How to Graph
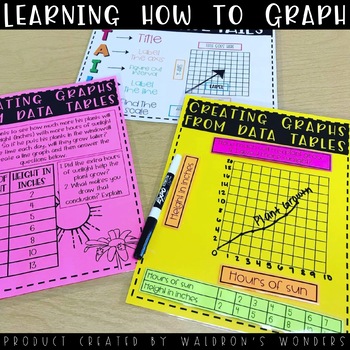
In this product you will find:-How to graph power point to go over the TAILS graphing procedure-Printable 8.5x11 posters for the students to use as a reference to use TAILS-A cut out of TAILS for their interactive notebooks-Creating graphs from word problems and data tables practice (6 different full page printables)-Creating graphs from data tables printables manipulatives (cut and glue/velcro/magnets etc. See product pictures for how I made them with Velcro!-Independent practice (could be a qu
Subjects:
Grades:
4th - 12th
Types:
Coordinate Graph Picture - I LOVE MATH!
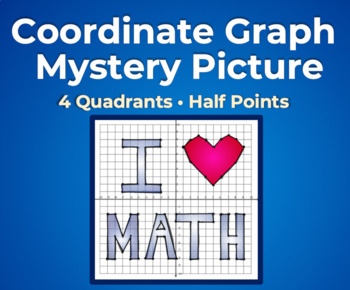
Great for beginners. This is my go-to graph after students learn the ins-and-outs of the four quadrants and half points or need a post-holiday-break reminder activity. The shapes are purposely out of order so that the message isn't revealed too quickly. It's fun when they figure out what it says, more fun when they roll their eyes at the absurdity of loving math. Bonus: Kids can color it in afterwards, and this makes for a beautiful, math-centric bulletin board to display student work, if you've
Grades:
4th - 8th
Types:
Showing 1-24 of 308 results


