6 results
High school statistics pdfs for parents
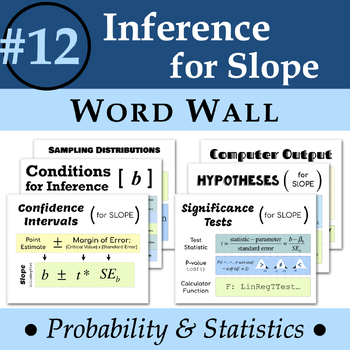
Statistics Word Wall #12: Inference for Slope
Statistics Word Wall #12: Inference for SlopeHelp your statistics students remember essential concepts and vocabulary with a visual word wall! Included are 6 letter-sized thematic posters that encompass over 12 terms! These terms align with Chapter 12 of TPS. TERMSSampling distributions of slope10% conditionNormality conditionConditions for inferenceConfidence intervals for slopeNull & alternative hypotheses for slopeSignificance tests for slopeTest statistic for slopeStandard error for slop
Subjects:
Grades:
9th - 12th
Also included in: Statistic Word Wall BUNDLE
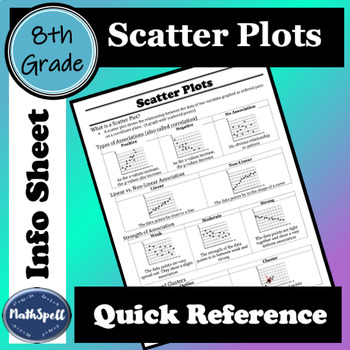
Scatter Plots and Correlation/Association | 8th Grade Math Quick Reference Sheet
This 8th Grade Math Quick Reference Sheet defines what a scatter plot is. Two sheets are provided to give you the option to use the term correlation or the term association. It shows examples for positive, negative, and no association/correlation and explains what each type means. Examples are given for linear and non-linear association/correlation, different strengths (weak, moderate, and strong) as well as what outliers and clusters are.This info sheet can be used for students to review scatte
Subjects:
Grades:
8th - 9th
Types:
CCSS:
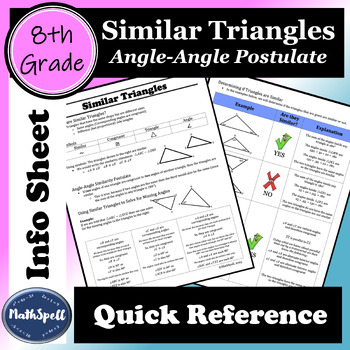
Similar Triangles | Angle-Angle Postulate | 8th Grade Math Quick Reference Sheet
This 8th Grade Math Quick Reference Sheet Defines what similar triangles areShows symbols for similar, congruent, triangle, and angleUses symbols to write similarity statementsExplains the angle-angle similarity postulate Describes how to use similar triangles to solve for missing angles in a triangleShows examples for determining if triangles are similar (includes an example that uses parallel lines cut by a transversal)The second page is available in color as well as black and white.This info
Subjects:
Grades:
8th - 9th
Types:
CCSS:
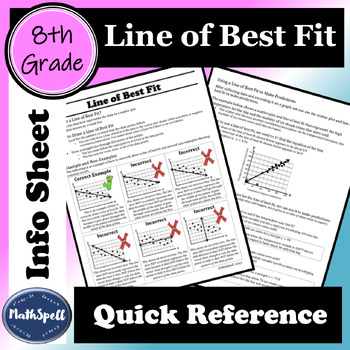
Line of Best Fit | 8th Grade Math Quick Reference Sheet | Cheat Sheet
This 8th Grade Math Quick Reference Sheet defines what a line of best fit is, explains how to draw a line of best fit, includes examples and non-examples to show common mistakes, and shows step-by-step examples of how to use a line of best fit to make predictions. The first page is available in color as well as black and white.This info sheet can be used for students to review Line of Best Fit after they've already learned about the concept or as an already complete notes page to help teach the
Subjects:
Grades:
8th - 9th
Types:
CCSS:
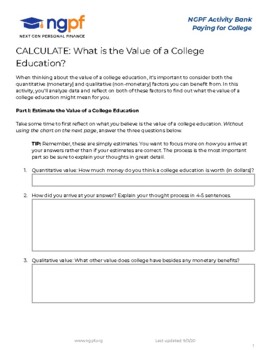
CALCULATE: What is The Value of A College Education?
Using research from the US Bureau of Labor Statistics, students will calculate the value of a college education. First, they will estimate its value. Then, they use a chart from the Dept. of Labor to calculate the value (in career earnings) of different levels of education. Finally they will reflect on that value. NGPF Activities teach your students key personal finance concepts while also honing their analytical skills.
Grades:
7th - 12th, Higher Education, Adult Education
Types:
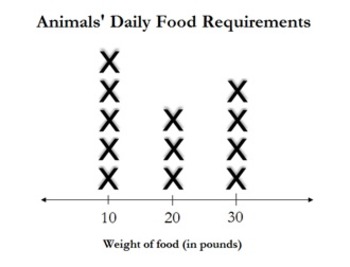
Statistical Analysis Learning Activity (with Answers)
This statistical analysis learning activity is designed by Jackson Education Support to offer students a fun, engaging learning experience. With this product, parents and teachers spend minimal time preparing to implement quality math activities that intertwine percentages and averages with a zoo-inspired storyline. PDF file includes math activity with line plot and detailed answer key.Click here to visit the blog and join the conversation...
Subjects:
Grades:
6th - 12th, Higher Education, Adult Education
Types:
Showing 1-6 of 6 results


