229 results
High school algebra 2 laboratories for parents
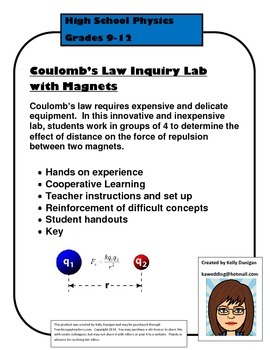
Coulomb's Law Inquiry Lab with Magnets
Coulomb's law requires expensive and delicate equipment. This chape and easy version is a clever and innovative inquiry lab that is appropriate for on-level, pre-AP, honors, and AP physics.
Students work in groups of 4 to determine the effect of distance on the repulsive force between two similar magnets. Disk magnets are best, neodymium disk magnets even better, but any small magnets will work.
Student express surprise at feeling the force of repulsion between the magnets. This is measured
Subjects:
Grades:
9th - 12th, Higher Education
Types:

Algebra 2 Summer Readiness Packet
This product was created to give to students entering Algebra 2 in order to help them review necessary content from Algebra 1 before the new school year starts. Each topic has an explanation with examples, helpful notes, and images of problems worked out by the instructor. There are between 10 and 16 practice problems per topic, with answer keys included.Topics covered:Solving Linear EquationsSolving Linear InequalitiesGraphing FunctionsIdentifying Key Features of GraphsDomain and RangeAdding an
Subjects:
Grades:
9th - 11th
CCSS:
Solving Systems of Equations by Substitution Station Rotation
A Hands-On Approach to Solving Systems of Equations by Substitution. This activity helps students to really understand the substitution method by having them physically replace a variable with its equivalent value.
Subjects:
Grades:
8th - 10th
Types:

Inverse Function Investigation with Desmos.com
In this online investigation, students use Desmos.com as a substitute for the traditional graphing calculator to investigate properties of inverse functions. This is a great introductory activity into inverse functions as it gives students a visual understanding of what a function and its inverse can look like. In the activity, students are instructed to create a table of values for a function, create the table of values for the inverse function, and graph the line y=x. In so doing, students
Subjects:
Grades:
8th - 9th
Types:
CCSS:
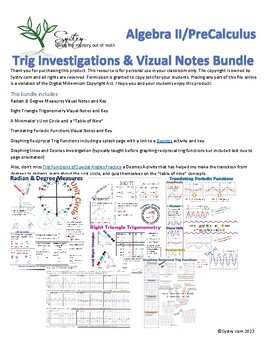
Trig Bundle
This bundle includes: Radian & Degree Measures Vizual Notes and KeyRight Triangle Trigonometry Vizual Notes and KeyA Minimalist’s Unit Circle and a “Table of Nine” Translating Periodic Functions Vizual Notes and KeyGraphing Reciprocal Trig Functions including a splash page with a link to a Desmos activity and key.Graphing Sines and Cosines Investigation (typically taught before graphing reciprocal trig functions but included last due to page orientation)Also, don’t miss Trig Functions of Sp
Subjects:
Grades:
10th - 12th, Higher Education
CCSS:
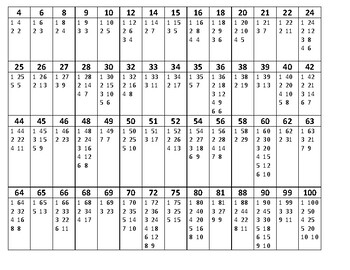
Factor Pair Chart
A table of factor pairs of most numbers 4-100.Great reference for factoring quadratic equations!
Subjects:
Grades:
8th - 11th
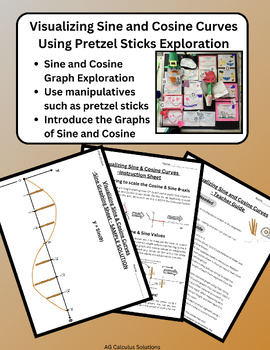
Introduction to Visualizing & Graphing Sine & Cosine Using Pretzels Exploration
Help students make connections while introducing the graphs of sine and cosine using mini pretzel sticks or equivalent manipulatives. Within this lesson, students will be able to interact with both the sine and cosine graphs using manipulatives such as string and pretzel sticks as they form a tactile graph in groups or individually. A thorough instruction sheet is provided to ensure all students are equipped to create their own pretzel graph. You can also substitute spaghetti, straws toothpicks
Subjects:
Grades:
10th - 12th
Types:
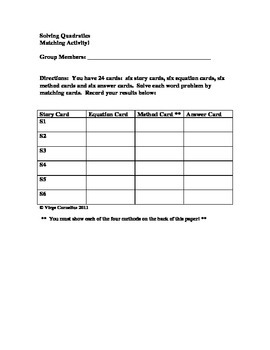
Matching Activity - Solving Quadratics
Three things come to mind as to why I wrote this activity...
First, students are petrified of word problems. I wrote this activity to give students experience with solving applications of the quadratic. Second, I want students to demonstrate their ability to use four different methods to solve quadratics. Third, I want students to be cognizant that they will need to decide which method is best given the structure of the quadratic equation.
There are 24 cards: 4 story cards, 4 equation car
Subjects:
Grades:
8th - 10th
Types:
Quadratic Functions - Introduction to graphing with Technology
I introduce my students to graphing quadratic functions using technology with this self made worksheet. My students like spending time in the computer lab, it gives them independence to try something new and they enjoy seeing the graphs be formed on the screen as soon as they type in an equation and they love getting out of the classroom! It is a lot more fun then graphing with paper and pencil.
I consider this work as a project because it is work done outside a classroom. It requires a com
Subjects:
Grades:
7th - 11th
Types:
CCSS:
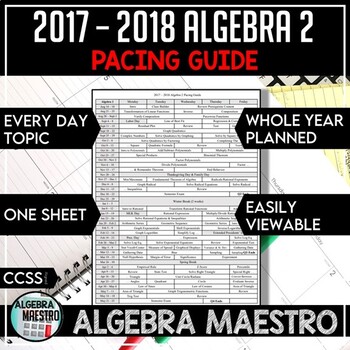
2017-2018 Algebra 2 Pacing Guide
With 2017-2018 Algebra 2 Pacing Guide, your planning for the year is done! I've taken the standards and learning targets for Algebra 2 and organized it for the year. It is one-sheet that is organized and user-friendly. You will know what to teach each day and know what topics are coming up. Non-teaching days are taken into account, such as testing, staff development days, etc. I hope that this helps you in your planning!Please review if you purchase! Thank you!Other 2017-2018 Mathematics Schedul
Subjects:
Grades:
8th - 12th, Higher Education, Adult Education

Webquest Investigation - Slope of a Line
Using a free online graphing calculator, students explore relationships between linear equations, their graphs, and the slopes of the lines. By the end of this investigation, students will discover relationships between parallel lines, perpendicular lines, and their slopes. Enjoy!
Subjects:
Grades:
7th - 11th, Adult Education
Types:
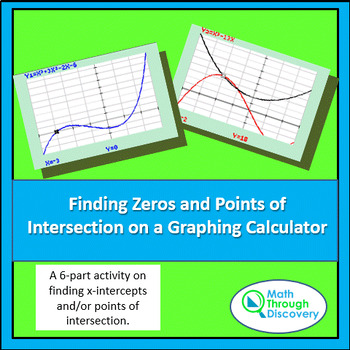
Alg 2 - Finding Zeros and Points of Intersection on a Graphing Calculator
This activity is broken into seven parts. Part I: Guides students in noticing that the trace key may not locate the x-intercepts (zeros) but shows them that there is another way x-intercepts can be found. Part II: Illustrates that there are algebraic techniques that can be incorporated in finding zeros.Part III: Shows student show to use a built-in feature to find x-intercepts or zeros.Part IV: Investigates how tables can be used to find x-intercepts and/or points of intersection. Part V: Chall
Subjects:
Grades:
10th - 12th
Types:

Trigonometric Functions on the Graphing Calculator - An Exploration
This activity sheet engages students in studying the general trigonometric equation y = a + b cos(cx) and making statements about the period, amplitude, y-intercept, and x-intercepts. After developing ideas with the cosine function, students make conjectures about similar sine graphs and then make a prediction of how a cosine graph would be changed to produce a particular graph.
Subjects:
Grades:
10th - 12th
Types:
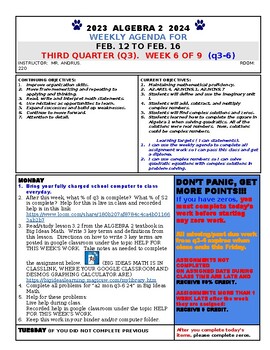
weekly agenda
weekly agenda with continuing and current objectives. can be easily modified to any subject. add your own assignments to each day. use the current info included in the document as ideas for your classes. https://docs.google.com/document/d/14wvjMInFY_ZCGX_KLP597gW6BV4kBdky-z2srQFGSIE/copy
Subjects:
Grades:
9th - 12th
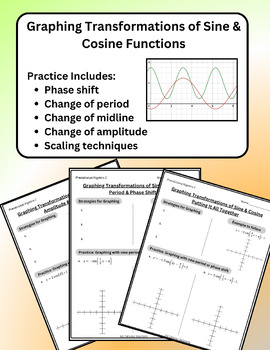
Transforming Sine & Cosine Graphs - Practice / Lesson / Worksheet
Help students learn how to graph all the transformations of the sine and cosine graphs using this interactive practice guide. The practice includes how to adjust the graph's period, amplitude, midline, phase shift and strategies for coming up with a proper scale for each tick mark on the x-axis. A comprehensive answer key is included in the packet along with some sample strategies to teach to students if needed. This lesson corresponds to AP Precalculus Sections 3-4, 3-5 and 3-6
Subjects:
Grades:
9th - 12th
Also included in: Transforming Sine, Cosine, Tangent, Secant, Cosecant, Cotangent BUNDLE
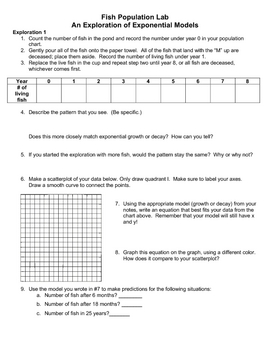
Population Lab: Exponential Growth and Decay
This lab is designed to give students a hands-on introduction to exponential growth and decay functions and their graphs.
Grades:
8th - 10th
Types:
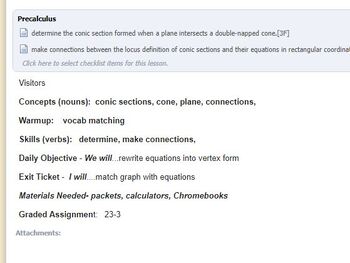
Lab: Drawing a Parabola
Uses the concept that a parabola is created when points are equidistant from a focus and a directrix. Students will need a compass, and 2 different colored pencils. A calculator may be needed. I recommend running the paper off on card stock.
Subjects:
Grades:
10th - 12th
Types:
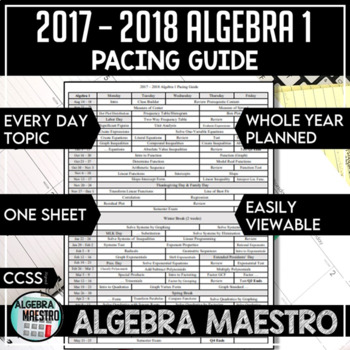
2017 - 2018 Algebra 1 Pacing Guide
With 2017-2018 Algebra 1 Pacing Guide, your planning for the year is done! I've taken the standards and learning targets for Algebra 1 and organized it for the year. It is one-sheet that is organized and user-friendly. You will know what to teach each day and know what topics are coming up. Non-teaching days are taken into account, such as testing, staff development days, etc. I hope that this helps you in your planning!Please review if you purchase! Thank you!Other 2017-2018 Mathematics Schedul
Subjects:
Grades:
7th - 11th, Higher Education, Adult Education
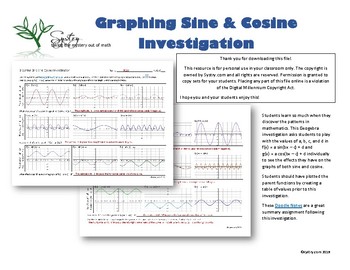
Graphing Sine & Cosine Investigation
Students learn so much when they discover the patterns in mathematics. This Geogebra investigation asks students to play with the values of a, b, c, and d in f(x) = a sin(bx – c) + d and g(x) = a cos(bx – c) + d individually to see the effects they have on the graphs of both sine and cosine.Students should have plotted the parent functions by creating a table of values prior to this investigation. These Vizual Notes are a great summary assignment following this investigation.If you are looking
Subjects:
Grades:
10th - 12th
Types:
CCSS:
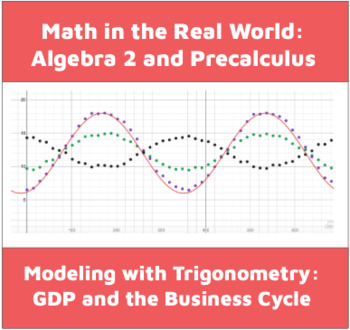
Modeling the Business Cycle with Trig Functions: Activity and Data Set
In this lab, students analyze GDP data from five fictional countries. To complete the activity, students:-- create scatterplots of their data using desmos.com/calculator (or other graphing utility)-- use their data sets to compute the parameters of underlying sinusoidal functions and use Desmos to compare their estimates to the data sets-- interpret the parameters of their equations in context by describing how the economies of each country compare and contrast to each other.-- are challenged to
Subjects:
Grades:
9th - 12th
CCSS:
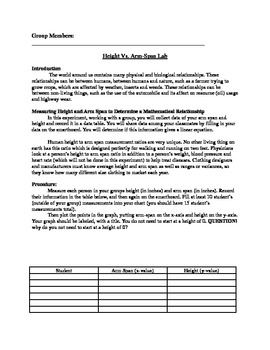
Height Vs. Arm Span Lab: Using real life data and linear regression
Students use their arm-span and heights to create a scatter plot and linear regression to find the equation for a line.
Subjects:
Grades:
8th - 12th
Types:

Common Core Math Practices - Introduction to Algebra Tiles
Use Algebra Tiles to teach foundational skills in Algebra like combining like terms, the distributive property, properties with integers, factoring trinomials, mulitplying binomials, solving equations and more!
Subjects:
Grades:
4th - 10th
Types:
Excellence in Algebra Exponential Curves
Printable as a single certificate per A4 sheet, this award is easily re-sized for multiple certificates per page. I generally print two per page to save card. Most of my certificates and awards are best printed on heavy 220gm white card stock, or matte photo paper. ☺Please note that at this point in time this certificate is designed to be printed as-is and personalized by hand☺ I hope you love this award! If you do (even if it’s a freebie) please consider leaving feedback so I know what you lik
Subjects:
Grades:
9th - 12th
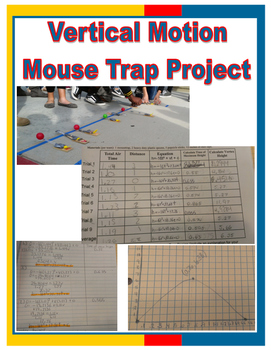
Vertical Motion Mouse Trap Project
Students will create mouse trap catapults from mouse traps, craft sticks, plastic spoons and duct tape. Students will launch ping pong balls and record initial height, time and distance for 9 trials. They will then find the average air time and average distance. Next, they will substitute in their average time (t), initial height (c), and end height (h) into the equation h=-16t² + vt + c and solve for v, for each of the 9 trials & average. Once they have their initial velocity they substitu
Subjects:
Grades:
9th - 12th
Types:
Showing 1-24 of 229 results


