147 results
Statistics Common Core MP5 resources
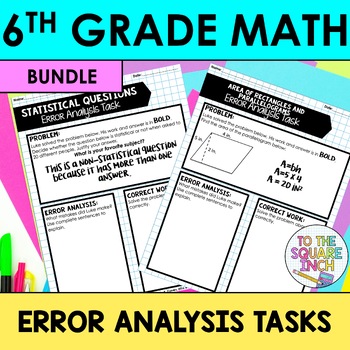
6th Grade Math Error Analysis
6th Grade Math Error Analysis Tasks - One task for each Common Core Standard70 different error analysis tasks for each 6th Grade Common Core Standard. This is a bundle of 5 different products at over a 20% discount. Please click on each link to see individual product descriptions. The Number System Topics include: Multiplying FractionsDividing FractionsDividing Mixed NumbersAdding and Subtracting DecimalsMultiplying DecimalsDividing Decimals by Whole NumbersDividing Decimals by DecimalsGreatest
Subjects:
Grades:
5th - 7th
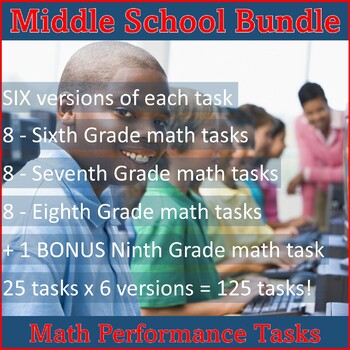
Middle School SBAC Math Performance Task (PT) Test Prep Bundle
The purpose of the Middle School SBAC Performance Task Bundle is to familiarize students with math performance tasks in preparation for standardized testing. This bundle includes 26 tasks, with six versions of each task. Each task covers 6th, 7th, & 8th Grade Common Core Standards with a multitude of applications. You can use these as class activities, proficiency practice, or quizzes. These tasks provide excellent practice for STARR testing and other state exams. As a bonus for purchasing t
Subjects:
Grades:
6th - 9th
Types:
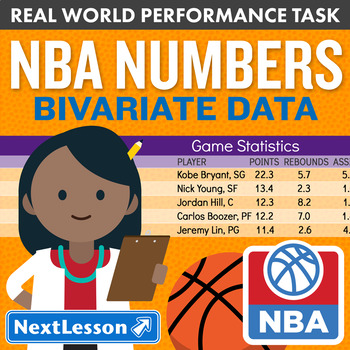
Bundle G8 Bivariate Data / Scatterplots - NBA Numbers Performance Task
Bundle of 29 editions of NBA Numbers Performance Task for 8th grade
In the NBA Numbers Performance Task, students use real data on the players in their favorite basketball team to practice interpreting a scatter plot and finding the equation for the line of best fit, and to extend into constructing a scatter plot from a set of data in an engaging, real world context. Students take on the role of a statistical analyst for the team and determine which player statistics are related to help make im
Subjects:
Grades:
8th
Types:
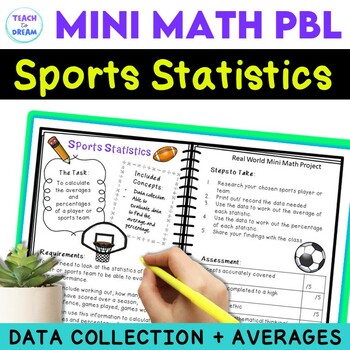
Inquiry Based Math Project | Data and Averages | Sports Statistics Grade 6th 7th
This Inquiry Based Math Project with the theme SPORTS STATISTICS, investigates percentages, averages and data. Students will be engaged and enjoy using numeracy in a real life situation. It has been designed for students in grades 4 to 7. Now suitable for in person and online learning with printable PDF and online Google slides.THE PERFECT WAY TO GET STUDENTS INTERESTED IN MATH!The projects are easy to follow and can either be teacher run or student driven. Each math project is designed to run b
Subjects:
Grades:
4th - 7th
Types:
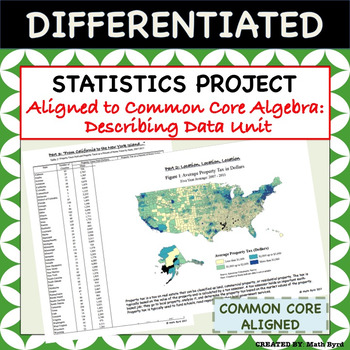
Statistics Project - Aligned to Common Core Algebra - Describing Data Unit
This differentiated U.S. Home Energy & Tax Themed Statistics Project covers all of the "describing data" standards of the Common Core Algebra Course using real data! Students will analyze various forms of tables & graphics to make inferences and interpret the data. The project is perfect for use as a summative assessment since students are required to justify their findings in open-ended format. Allow students to work in pairs, small groups, or individually! A grading rubric and selected
Subjects:
Grades:
8th - 11th
Types:
CCSS:
Also included in: Common Core Algebra 1 PROJECTS - BUNDLE PRICE!
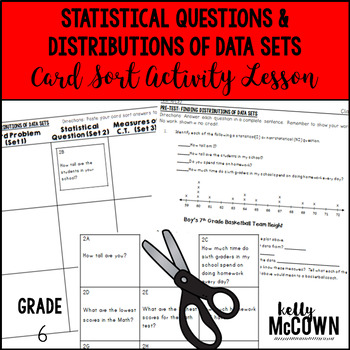
Statistical Questions & Distributions of Data Sets Card Sort Activity Lesson
This lesson unit is intended to help you assess how well students are able to recognize a statistical question as one that anticipates variability in the data related to the question and accounts for it in the answers. Understand that a set of data collected to answer a statistical question has a distribution which can be described by its center, spread, and overall shape.
Included in this lesson are:
-One formative assessment (pre-test) tasks
-Card sort activity with concept development o
Subjects:
Grades:
6th
Types:
Also included in: Math Card Sort Activity Grade 6 BUNDLE
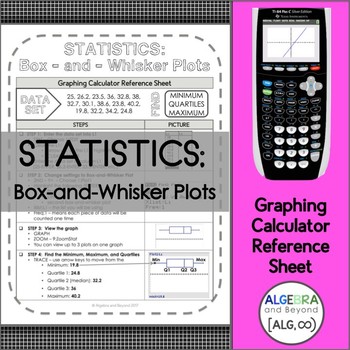
Statistics | Box-and-Whisker Plots | TI-84 Graphing Calculator Reference Sheet
This graphing calculator reference sheet on box-and-whisker plots guides students step-by-step on how to create a list, graph, and find the minimum, quartiles, and maximum.Teaching graphing calculator skills help students with: • Speed• Making connections• Checking for accuracy• Leaping hurdles*Reference sheet can be used with a TI-83 or TI-84 graphing calculator. Please look at the preview to find out more information about this resource.Check out more graphing calculator sheets here or get all
Subjects:
Grades:
10th - 12th
Types:
CCSS:

Math 8 Complete Year Lessons, Worksheets, and Assessments
Includes143 Editable PowerPoint Lessons143 PDF Homework Worksheets39 Editable In-Class Worksheets for graphing lessons (no additional graph paper required)19 Editable Student Self-Reflection Worksheets (Microsoft Word)19 Editable Unit Tests (Microsoft Word)1 Editable Final Exam (Microsoft Word)A $160 value if each item is purchased separately.Lessons are fully editable using the equation editor and drawing tools provided in Microsoft Word and PowerPoint (no additional editor required).These less
Subjects:
Grades:
8th
Types:
End of the Year Activities Math Graphing Project Choice Board
Looking for a fun way to review graphing and other Math concepts at the end of the year? The End of the Year Activities Math Project Choice Board consists of 9 different open-ended activities that help to give students voice and choice in their learning while investigating different math concepts. This board is designed with the middle school student in mind, each activity can be used in a home, hybrid, or school setting, and it comes in both a PDF and editable digital format.What's Included?Te
Subjects:
Grades:
6th - 7th
Types:
Also included in: End of the Year Activities Project Choice Board Bundle
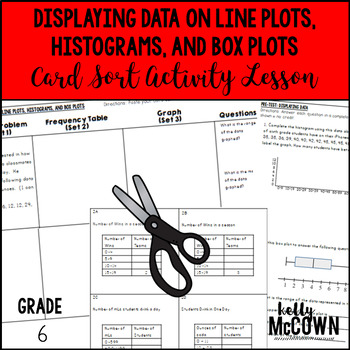
Displaying Data on Line Plots Histograms Box Plots Card Sort Activity Lesson
This lesson unit is intended to help you assess how well students are able to display numerical data in plots on a number line, including line plots, histograms, and box plots.Included in this lesson are: One formative assessment (pre-test) tasks Card sort activity with concept development of displaying data on line plots, histograms, and box plots: Displaying Data on Line Plots Histograms Box Plots Cut & Paste Activity (Value $4.00) One extension activity for students to deepen their conce
Subjects:
Grades:
6th
Types:
Also included in: Math Card Sort Activity Grade 6 BUNDLE
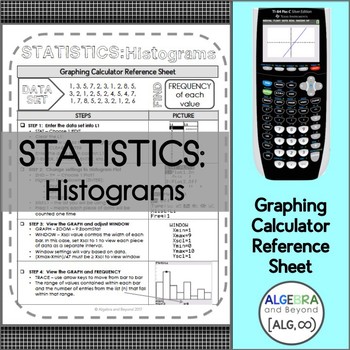
Histograms | Statistics | TI-84 Graphing Calculator Reference Sheet
This graphing calculator reference sheet on histograms guides students step-by-step on how to create a list, graph, and find the frequency values.Teaching graphing calculator skills help students with: • Speed• Making connections• Checking for accuracy• Leaping hurdles*Reference sheet can be used with a TI-83 or TI-84 graphing calculator. Please look at the preview to find out more information about this resource.Check out more graphing calculator sheets here or get all of them...Graphing Calcul
Subjects:
Grades:
10th - 12th
Types:
CCSS:
PROBABILITY: A STUDENT'S ACTIVITY/KNOWLEDGE BOOKLET GRADES 5-8, MG, & MATH CLUB
This is an independent activity booklet on probability. It is designed to enhance the learning of this mathematical theory. It has real life applications, a quiz, quotes, mystery quiz, biographies, and a writing prompt, etc. The intent is to show students how math is an integral part of life, and its functions. Answer keys are included. There is an art-design component for 2 activities, as well. This is a beginner-introduction/ supplement to this topic. Excelsior! Thank you ever so much for
Subjects:
Grades:
5th - 8th, Adult Education, Staff
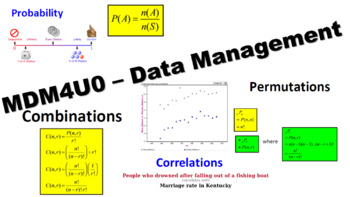
MDM4U - Grade 12 Math - Mathematics of Data Management - FULL COURSE!
This is my complete course package for the Grade 12 Data Management (MDM4U) course following the Ontario Secondary Mathematics Curriculum. This package includes:Smart Notebook and PowerPoint lessons with Student PDF versions for every lesson of every unit in the course. (I have also included versions with my notes for your use)A complete student workbook that covers every lesson in the course. Each lesson concludes with appropriate workbook sections, so you can use whatever textbook you want!App
Subjects:
Grades:
12th
CCSS:
6th Grade Math Performance Tasks Bundle
Performance Tasks are high-interest activities with real world math application. These are a great way to supplement your instructional tools to engage your students, develop critical thinking skills and make connections to the real world.
Now you can save time and money with this collection of 6th grade Performance Tasks! This easy to manage bundle includes 64 Performance Tasks, which cover 100% of the Common Core State Standards for 6th grade, and an index so you can quickly find a Performanc
Subjects:
Grades:
6th
Types:
'Create Your Own Survey' Statistics Project!
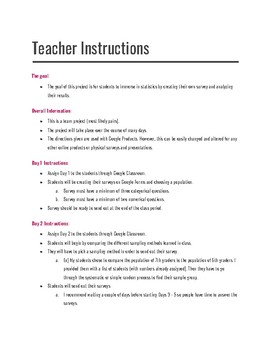
Students will be engaged with statistics in this fun project!In pairs, students will create a survey to send out that will compare two populations. They will be responsible for creating samples of each population. They will then send out the survey and analyze the results. Students will use mean, median, range and interquartile range to describe their data. This is a great project for the end of the year.Access to the original Google Doc is available in the PDF.
Subjects:
Grades:
6th - 8th
Types:
Fun with Ratios Activities Bundle - 7th Grade PBL with Math
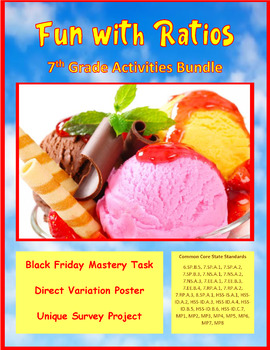
The purpose of the Fun with Ratios Activities Bundle is to give students the opportunity to use creativity to apply ratios, proportions, and percentages in real-world settings. This bundle includes three unique tasks: Black Friday Mastery Task, Direct Variation Poster Mastery Task, and the Unique Survey Project. These activities and their accompanying materials are suited for students in grades 7 through 9. These lessons make excellent sub plans. Each project takes approximately two 60-minute bl
Subjects:
Grades:
7th - 9th
Types:
IM Grade 6 MathTM Guided Math Notes and Teacher Version
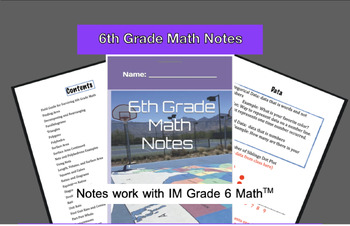
Here are all the notes needed for 6th grade math. This product included the student and teach version of the notes. This resource is based on the IM K-12 MathTM authored by Illustrative Mathematics® and offered under a CC BY 4.0 License.
Subjects:
Grades:
6th
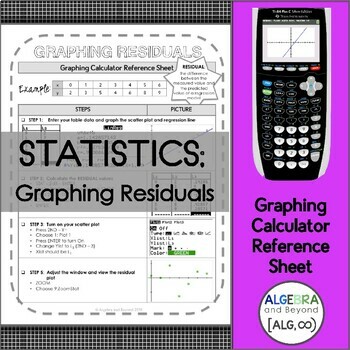
Residuals | Statistics | TI-84 Graphing Calculator Reference Sheet
This graphing calculator reference sheet guides students step by step with visuals on how to graph residual plots.*Important: this sheet does NOT teach them how to graph a scatter plot or a line of regression. If students need these steps, please also purchase the Linear Regression graphing calculator reference sheet to accompany the residual sheet.Teaching graphing calculator skills to help students with: • Speed• Making connections• Checking for accuracy• Leaping hurdles*Reference sheets can b
Subjects:
Grades:
10th - 12th
Types:
CCSS:
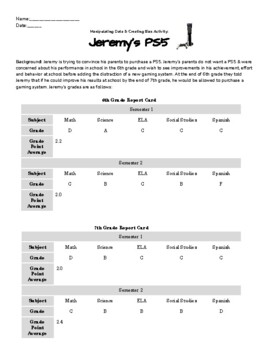
Manipulating Data & Creating Bias Activity
Manipulating Data & Creating Bias Activity: Teach your students about how charts and statistics can be skewed; and real numbers can reflect bias with this fun project! Students are given a role (either Jeremy or his parents) and have to use two pieces of data from Jeremy's 6th & 7th grade report card to argue for or against his deserving of a PS5!Students get to be creative & make cross-curricular connections to ELA as they use logical fallacies & skewed graphs to make their argu
Subjects:
Grades:
4th - 11th
Types:
CCSS:
NGSS:
HS-ETS1-4

IB Applications & Interpretations SL: Unit 7-Quantifying Uncertainty-Probability
IB Applications & Interpretations SL, Unit 7 - Quantifying Uncertainty - Probability, Binomial and Normal Distribution.This bundle includes 7 guided notes lessons, teacher guides for each day, 2 assessments and assessment reviews (lessons 6.1-6.3), an end-of-unit performance task, and an assignment sheet pacing guide, including recommended hw extra practice. Topics include:1) Basic Concepts of Probability and Counting2) Conditional Probability and the Multiplication Rule3) The Addition Rule4
Subjects:
Grades:
10th - 12th

IB Applications & Interpretations SL: Unit 3-Representing&Describing Data-Stats
IB Applications & Interpretations SL, Unit 3 - Representing and Describing Data - Descriptive Statistics.This bundle includes 7 guided notes lessons, teacher guides for each day, 2 assessments and assessment reviews (lessons 3.1-3.3, and 3.1-3.6), and an assignment sheet, including recommended hw extra practice. Topics include:1) Types of data2) Measures of central tendency3) Measures of variation4) Sampling techniques5) Presenting data6) Bivariate data
Subjects:
Grades:
10th - 12th
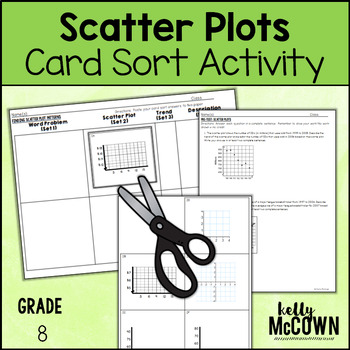
Scatter Plots Card Sort Activity
This lesson unit is intended to help you assess how well students are able to construct and interpret scatter plots, use bivariate measurement data to investigate patterns of association between two quantities, and describe patterns such as clustering, outliers, positive or negative association, linear association, and nonlinear association.Included in this lesson are:Directions, grade level common core standards, and mathematical practicesFormative assessment (pre-test) task Card sort activity
Subjects:
Grades:
8th
Types:
Also included in: Math Card Sort Activity Grade 8 BUNDLE
Probability Activities for 7th Grade Math Stations Now®️ Math Game Activity
Are you looking for Math Workshop Activities to use in your classroom for Probability that will not only allow you to make the best use of your planning time but also allow you to easily implement Math Workshop because the planning is already done for you?**Want to know more? Check out the video here to learn more about the Math Workshop Concept-Based Activities!**Within this Weekly Unit, you will find 8 activities provided to you for you to pick and choose, or even allow a choice among your stu
Subjects:
Grades:
7th
Types:
Also included in: 7th, 8th & Algebra Grade Math Workshop Bundle Math Stations Now®️ Games

IB Applications & Interpretations SL: Unit 6 -Modeling Relationships - Bivariate
IB Applications & Interpretations SL, Unit 6 - Modeling Relationships - Linear Correlation of Bivariate Data.This bundle includes 5 guided notes lessons, teacher guides for each day, 1 assessment and assessment review (lessons 6.1-6.3), an end-of-unit performance task, and an assignment sheet pacing guide, including recommended hw extra practice. Topics include:1) Piecewise Functions2) Scatterplots3) Correlation4) Line of Best Fit5) Interpreting the Regression Line
Subjects:
Grades:
10th - 12th
Showing 1-24 of 147 results


