29 results
Measurement Common Core 6.SP.B.5b resources
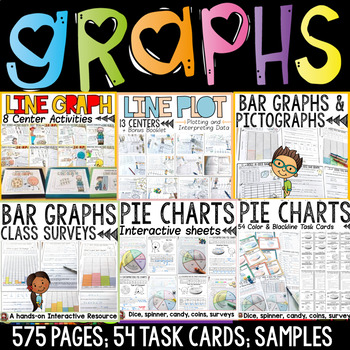
Bar Graphs Pictographs Line Graphs Line Plots Pie Charts Data Collection Bundle
The graphing bundle features interactive activities for creating and interpreting bar graphs, pictographs, line graphs, line plots and pie charts. Your entire graphing unit for a year!Separate folders featuring both British English and US spellings and terminology included.Great quality and value for this whopping 575 + page unit on graphing! Data is collected and interpreted using concrete materials such as visuals, dice, spinners, coins and other real-life objects and contexts. Further details
Subjects:
Grades:
2nd - 6th
Types:
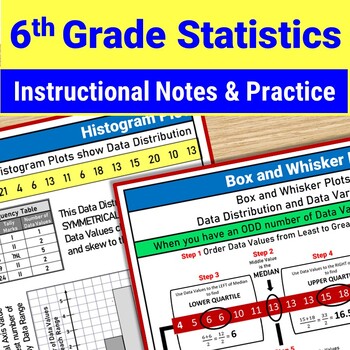
6th Grade Statistics Project Box Plot Mean Median Mode Range Histogram Activity
Teach all 6th Grade Statistics and Probability Standards with this 10-day Instructional Notes and Practice Unit. Calculate Measures of Central Tendency (mean, median, mode, range) and Mean Absolute Deviation. Master Data Display with Box and Whisker Plots, Histograms, Dot Plots, Stem and Leaf Charts. Write Statistical Questions. Analyze Data Distribution and Data Variability. No need to dread teaching 6th Grade Statistics because your textbook does a mediocre job of explaining how to calculate a
Subjects:
Grades:
6th - 8th
NGSS:
MS-ETS1-2
CSI: Data Analysis & Probability Activity - Printable & Digital Review Game
Nothing like a good criminal investigation to liven up data analysis and probability! In this project, students will work in teams to investigate the culprit of six fictional thefts. The criminal has left six messages, layered with algebra. Teams will work to build a case and present their findings to the court. Hopefully they are convincing enough to win the verdict.The puzzle solving hook causes many different students to engage in solving traditionally mundane problems. Be the cool teacher :-
Subjects:
Grades:
6th - 12th
Types:
Also included in: Probability & Expected Value Unit Bundle - Distance Learning Compatible
Math Stations Middle School Bundle
Do your students love independent math stations? These math stations are great for practice and math skills review. A COMPLETE MIDDLE SCHOOL BUNDLE covering all 6th, 7th, & 8th grade math standards! There is NO PREP needed. Just print each math station activity and go teach today! Easy to incorporate into your math workshops. Students will love learning and independently working at each math station. All math skills are covered in the middle school math stations. Here's what you'll get: 44 M
Subjects:
Grades:
6th - 8th
Types:
6th Grade Math Statistics and Probability Curriculum Unit CCSS Aligned
This 5 lesson CCSS aligned Statistics and Probability Unit includes a full set of lessons/guided notes that cover all of the statistics 6th grade standards as well as an assessment and study guide. Topics included are statistical questions, measures of center and mode (mean, median, range, and mean absolute deviation), dot plots, histograms, and box and whisker plots. This unit has all instructional lessons needed to cover and teach the 6th grade statistics and probability standards to your stud
Subjects:
Grades:
6th
Also included in: 6th Grade Math Curriculum CCSS Aligned Bundle
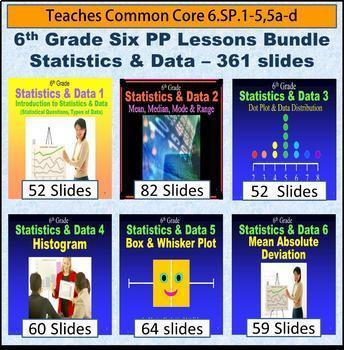
6th Grade Statistics & Data Bundle - 6 Powerpoint Lessons - 402 Slides
Sixth Grade Statistics and Data Bundle - It is composed of 6 different lessons comprising 402 slides on the following: Statistics and Data 1 - Statistical Questions and Types of Data, Statistics and Data 2 - Mean, Median, Mode & Range, Statistics and Data 3 - Dot Plot and Data Distribution, Statistics and Data 4 - Histogram, Statistics and Data 5 - Box and Whisker Plot, Statistics and Data 6 - Mean Absolute Deviation. For more information on these powerpoint lesson click on the individu
Subjects:
Grades:
6th
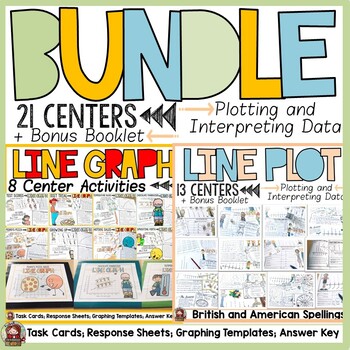
Line Graphs and Line Plots With Fractions and Whole Numbers Centers Bundle
Line Graphs and Line Plots with fractions and whole numbers feature interactive center activities. Data is collected using concrete materials such as visuals, dice, spinners, coins and other real-life objects and contexts. Further details about the graphs featured in this bundle are:1. LINE GRAPHSThis is a 145 page unit on Line Graphs that contains visual interactive activities to collate, record and interpret data in line graphs. Items Included8 center Activities (color and blackline): for eac
Subjects:
Grades:
3rd - 7th
Types:
Scientific Method Activity Practice Data Analysis Qualitative and Quantitative
This activity has students collect QUALITATIVE and QUANTITATIVE DATA about the candy in a mixed pack, such as Skittles or M&Ms. There are many candy activities out there, but none quite covered the quantitative and qualitative skills I wanted my middle school students to practice, so I designed my own! This lab is designed to be simple so that students can master beginner lab and data collection skills.In this activity, students will:READ an article about the differences between qualitativ
Subjects:
Grades:
6th - 8th
Types:
Also included in: Introduction to Experimentation Activity Set for Middle School Science
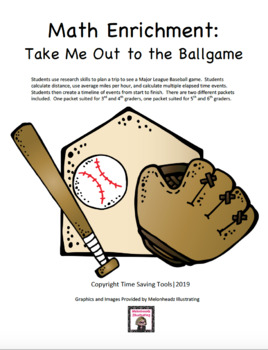
Take Me Out to the Ballgame: Baseball Math Enrichment Project
This is a real world enrichment project for those students who need some deeper work in mathematics. Students will use a variety of skills to complete this project including, research skills, elapsed time skills, measurement skills, and higher level thinking skills. This is a great way to provide differentiation in the classroom. There is a 3rd/4th grade packet and a 5th/6th grade packet included. This is great for gifted and talented students. It also can be a great family activity to work
Subjects:
Grades:
3rd - 6th
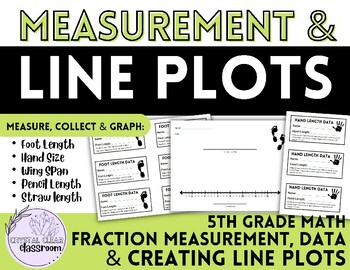
LINE PLOTS - Student Measurement, Data &Graphing Activity 5th-6th Grade math
Are you looking for a engaging way to teach your students how to collect data and create lines plots based on REAL data? This resource is all about measuring, collecting data, and graphing data using a line plot. This resource includes:Teacher InstructionsFoot Length Data Collection Card + Scaffolded line plots (3 options)Hand Length Data Collection Card + Scaffolded line plots (3 options)Wing Span Data Collection Card + Line PlotPencil Length Data Collection Card + Line PlotStraw Length Data Co
Subjects:
Grades:
4th - 6th
Types:
Also included in: Measurement and Data 5th Grade 4 RESOURCE BUNDLE + BONUS FREEBIE
I06N-Nouveau programme-cadre de mathématiques de l’Ontario, 6e année
À propos de cet aide-mémoire… La 6e année est une année critique en Ontario puisque l’élève doit être évalué sur ses connaissances dans les domaines de la lecture, de l’écriture et des mathématiques lors de l’évaluation provinciale de l’OQRE (EQAO). Les contenus d’apprentissage sont plus nombreux et la résolution de problèmes fait appel à la logique, à l’estimation et au calcul mental, des habiletés qui ont été développées précédemment et qui sont devenues, espérons-le, des automatismes. De plu
Subjects:
Grades:
6th - 7th
MAP Math Practice: Data and Measurement (RIT Band 210-220)
This resource provides practice problems for the data and measurement strand of the NWEA Map test (RIT band 210-220). Problems are provided in multiple-choice worksheet form as well as task card form so that they can be used independently, in whole group review, or in small group centers, scavenger hunts, or even Scoot games.
Subjects:
Grades:
3rd - 6th
Types:
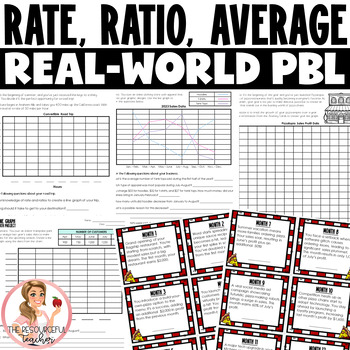
Ratio, Rate, & Average | Project-Based Learning Activities
This Rate, Ratios, and Average Project-Based Learning Activity is designed to bring math to life for students. This innovative activity pack is tailored to help students grasp the concepts of rate, ratio, and average through engaging, real-world scenarios. Four Dynamic Real-World Scenarios:Trampoline Park Tycoons: Students step into the shoes of entrepreneurs owning an indoor trampoline park. They'll use a line graph to analyze last year's sales data, diving deep into the concept of averages to
Subjects:
Grades:
6th
Types:
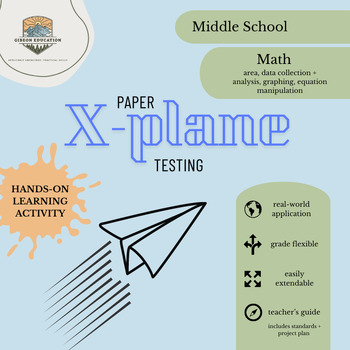
Middle School Math X-Plane Testing Project
This project-based Learning Packet is meant to be used as an assessment or review tool for an array of middle school math topics, including area of a 2-D shape, data collection + analysis, graphing, and equation manipulation! This packet is based on the actual testing process of NASA's X-wing experimental planes! This Learning Packet is designed to be flexible for use with grades 6-8 and easily extendable.For this project, students will:Build (or fold!) three different models of paper planesCalc
Subjects:
Grades:
6th - 8th
Types:
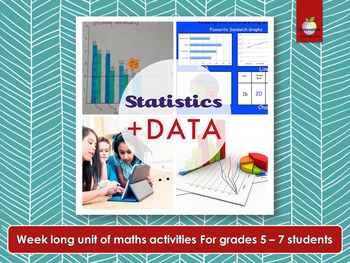
Statistics & Data Math Unit | Project Based Learning | Mean, Median, Mode, Range
Make math relevant and engaging for your students with the elementary/primary STATISTICS and DATA PROJECT. This NO PREP, this hands-on PROJECT-BASED LEARNING, will keep your class busy learning about MEAN, MEDIAN, MODE and RANGE for a whole week.COVERINGHow to ask and survey an “essential question.”Data collection methodsDrawing mathematical conclusions from dataPresenting data in graphs and tablesPresenting data and conclusions to peersThis insightful project makes a great, lively introduction
Subjects:
Grades:
5th - 7th
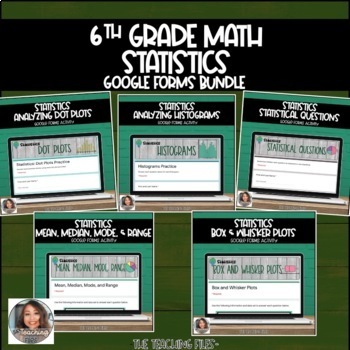
Statistics Bundle Practice 6th Grade Math CCSS Aligned
This bundle includes 5 Google Forms resources with questions for targeted practice of all of the Statistics topics in 6th grade CCSS Standards:Dot Plots, Histograms, Statistical Questions, Mean Median Mode and Range, and Box and Whisker Plots.About This Product:-Google Forms resources- 5 Google Forms covering the following topics:HistogramsDot PlotsStatistical QuestionsMean, Median, Mode, and RangeBox and Whisker Plots-Over 20 questions in this bundle-Each form is valued at $1.75 individually-
Subjects:
Grades:
6th
Types:
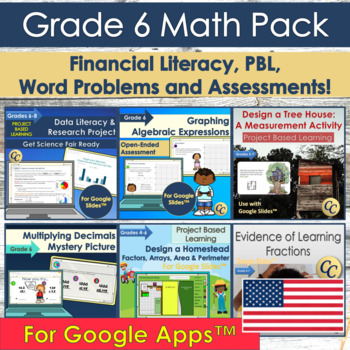
Grade 6 Math Pack for Google Apps™ | Financial, Data Literacy and PBL
Everything you need to assess grade 6 math in a meaningful and engaging way. Grade 6 Math Pack includes: project based learning, financial literacy, data literacy and real-world word problems! Covers topics such as: Measurement Converting unitsMultiplying decimalsFactors, multiplesGraphing equationsSolving algebraic equationsFractionsFinancial LiteracyCross-Curricular links to language and science!Works great in-class or for remote learning.→ For the printable and Easel version click here.→ For
Subjects:
Grades:
6th
Types:
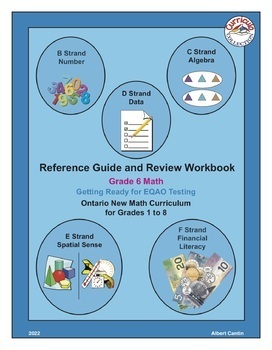
I06N-Ontario New Math Curriculum, Grade 6
About this Reference Guide and Review Workbook… Grade 6 is a critical year in Ontario as the students must be assessed on their knowledge of reading, writing, and math with the provincial EQAO tests. Furthermore, the students are also in their last year in the primary cycle and must prepare to enter the middle cycle next year. In an effort to further improve their math skills, the following Reference Guide and Review Workbook has been developed in the most practical and straightforward way poss
Subjects:
Grades:
6th - 7th
Constants, Variables, & Level of Measurement Animated PPT w/ Scaffolded Notes
This constants, variables, and level of measurement resource contains an interactive and animated PowerPoint with matching scaffolded style notes for your scientific method or statistics unit. There is a Tip & Tricks slide and corresponding note page that compiles feedback, notes, and helpful information I have personally seen benefit my students.Please be aware that this lesson was designed for a criminal justice-based statistics course; as such, topics and applied word problems use related
Subjects:
Grades:
Not Grade Specific
CCSS:
NGSS:
HS-LS3-3
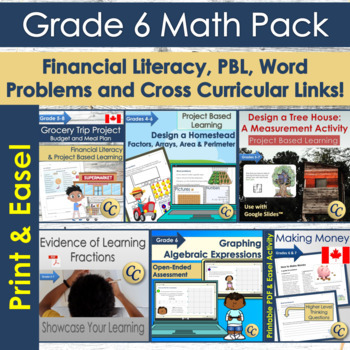
Canadian Grade 6 Math Bundle | For Print and Easel
Everything you need to assess grade 6 math in a meaningful and engaging way. Grade 6 Math Pack for Canadian Students includes: project based learning, financial literacy, data literacy and real-world word problems, all specifically Canadian!Works great in-class or for remote learning.→ For the Google Apps™ version, click here.Cross-Curricular links to language and science!Graphing Algebraic Expression slides include: (Made-For-Easel Resource - 23 Slides)10 questions total5 are solve for x or y
Subjects:
Grades:
6th
Types:
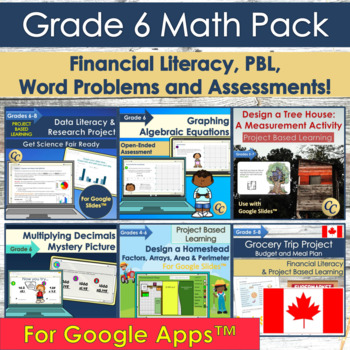
Canadian Grade 6 Math Pack for Google Apps™ | Financial, Data Literacy and PBL
Everything you need to assess grade 6 math in a meaningful and engaging way. Grade 6 Math Pack for Canadian Students includes: project based learning, financial literacy, data literacy and real-world word problems, all specifically Canadian!Covers topics such as: Measurement Converting unitsMultiplying decimalsFactors, multiplesGraphing equationsSolving algebraic equationsFractionsFinancial LiteracyCross-Curricular links to language and science!Works great in-class or for remote learning.→ For
Subjects:
Grades:
6th
Types:
Constants, Variables, & Level of Measurement Animated PPW, Knowledge Checks
This constants, variables, and level of measurement resource contains an interactive and animated PowerPoint for your scientific method or statistics unit. You can also purchase the matching scaffolded notes. There is a Tip & Tricks slide and corresponding note page that compiles feedback, notes, and helpful information I have personally seen benefit my students.Please be aware that this lesson was designed for a criminal justice-based statistics course; as such, topics and applied word prob
Subjects:
Grades:
Not Grade Specific
CCSS:
NGSS:
HS-LS3-3
Categorical Data Smartboard Slides Lesson Displaying Analyzing Organizing
Categorical-Data Math Smartboard-Slides-Lesson covers the TEKS for 6th grade Math specific to this skill. Lots of great examples and teaching, along with interactive practice for your students. You'll LOVE this resource and use it year after year! WARNING: You MUST have SMART Technologies SMART software, and a SMARTBOARD to teach from, to effectively download, open and use this Interactive Smartboard Lesson. Go to https://legacy.smarttech.com/en/products/education-software/smart-learning-suite/
Subjects:
Grades:
5th - 8th
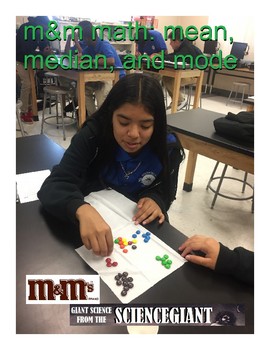
M&M Math: Candy Counting and Graphing of Mean, Mode, Median, and Range
Look at the bag. It’s where M&M’s hide. Can you guess how many M&M’s are inside? To get an answer about the amount, Pour out the candies and count, count, count. Sort them by color. Call each group a set. Count each different color, but don’t eat them yet! All numbers have value, a fact we must face. See them in columns. Put them in their place.This is an edible math activity using a hands-on manipulative materials: m&m candies! Although Ts can substitute for Skittles, Reese's P
Subjects:
Grades:
6th - 9th
Types:
Also included in: StayGiant Candy Mix Bundle: Lab Investigations
Showing 1-24 of 29 results


