TPT
Total:
$0.00
19 results

Social studies Common Core 6.SP.B.5b resources
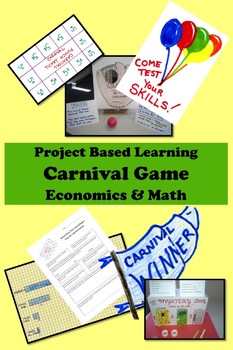
Preview of Carnival Game Economics PBL Project-Based Learning GATE
Carnival Game Economics PBL Project-Based Learning GATE

Smaller tasks add up to big, big learning with this gold medal standard project-based learning activity! What a sneaky cool way to learn math, economics, and functional design! (Insert evil teacher laugh.) It’s a hands-on approach to Common Core Standards. In Carnival Game Economics, students design a carnival skill game and gather data as junior market researchers during the test phase. They’ll use this data to help make decisions. After making calculations for probability, students will
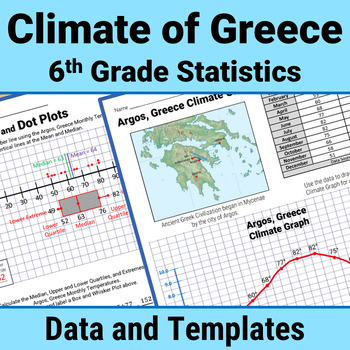
Preview of Greece Geography 6th Grade Statistics Box Plot Histogram Mean Median Activity
Greece Geography 6th Grade Statistics Box Plot Histogram Mean Median Activity

Enrich your study of Ancient Greece using 6th Grade stats skills to analyze Greek climate data. Calculate Measures of Central Tendency (mean, median, mode, range) and Mean Absolute Deviation. Master Data Display with Box and Whisker Plots, Histograms, Dot Plots, Stem and Leaf Charts. Write Statistical Questions. Analyze Data Distribution and Data Variability.All with climate data (temperature and precipitation) from Greece!This Print and Go STEM/STEAM PBL resource includes 70+ pages of climate d
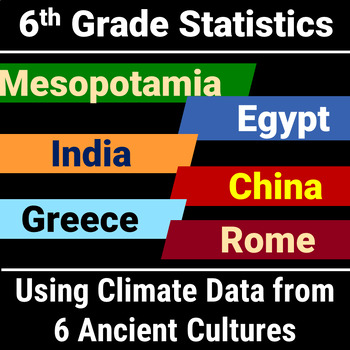
Preview of 6th Grade Statistics Project Activity with Climate Data from 6 Ancient Cultures
6th Grade Statistics Project Activity with Climate Data from 6 Ancient Cultures

Enrich your study of ancient cultures using 6th Grade Statistics and Probability skills to analyze climate data. Calculate Measures of Central Tendency (mean, median, mode, range) and Mean Absolute Deviation. Master Box and Whisker Plots, Histograms, Dot Plots, Stem and Leaf Charts. Write Statistical Questions. Analyze Data Distribution and Data Variability. Apply climate analysis to ancient settlement patterns Answer the "how will I use this math" question!If you only teach Mesopotamia, Egypt,
Preview of Egypt Geography 6th Grade Statistics Mean Median Mode Range Box Plot Activity
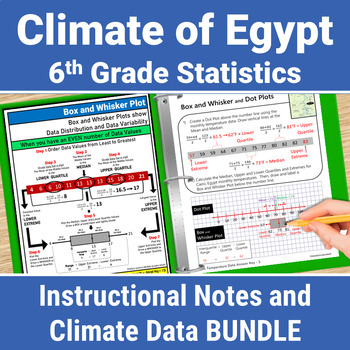
Egypt Geography 6th Grade Statistics Mean Median Mode Range Box Plot Activity

Enrich your study of Ancient Egypt using 6th Grade stats skills to analyze Egypt climate data. Master Data Display with Box and Whisker Plots Activity, Histograms, Dot Plots, Stem and Leaf Charts. Calculate Measures of Central Tendency (mean, median, mode, range) and Mean Absolute Deviation. Write Statistical Questions. Analyze Data Distribution and Data Variability.All with climate data (temperature and precipitation) from Egypt!This Print and Go STEM/STEAM PBL resource includes 120 pages of In
Preview of India Geography 6th Grade Statistics Box Plot Histogram Mean Median Activity
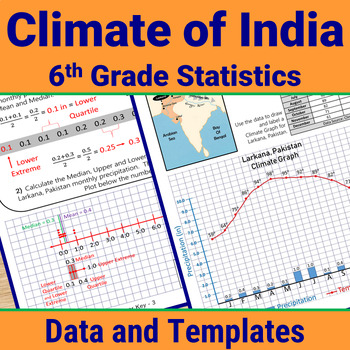
India Geography 6th Grade Statistics Box Plot Histogram Mean Median Activity

Enrich your study of India using 6th Grade stats skills to analyze India climate data. Calculate Measures of Central Tendency (mean, median, mode, range) and Mean Absolute Deviation. Master Data Display with Box and Whisker Plots, Histograms, Dot Plots, Stem and Leaf Charts. Write Statistical Questions. Analyze Data Distribution and Data Variability.All with climate data (temperature and precipitation) from ancient Indian sites!This Print and Go STEM/STEAM PBL resource includes 70+ pages of clim
Preview of Egypt Geography 6th Grade Statistics Box Plot Histogram Mean Median Activity

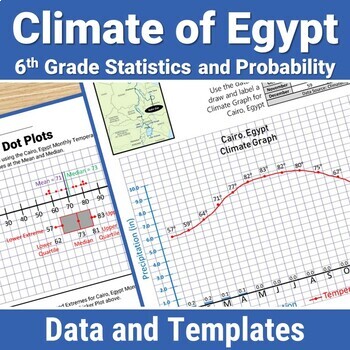
Egypt Geography 6th Grade Statistics Box Plot Histogram Mean Median Activity
Enrich your study of Ancient Egypt using 6th Grade stats skills to analyze Egypt climate data. Calculate Measures of Central Tendency (mean, median, mode, range) and Mean Absolute Deviation. Master Data Display with Box and Whisker Plots, Histograms, Dot Plots, Stem and Leaf Charts. Write Statistical Questions. Analyze Data Distribution and Data Variability.All with climate data (temperature and precipitation) from Egypt!This Print and Go STEM/STEAM PBL resource includes 70+ pages of climate dat
Preview of China Geography 6th Grade Statistics Box Plot Histogram Mean Median Activity

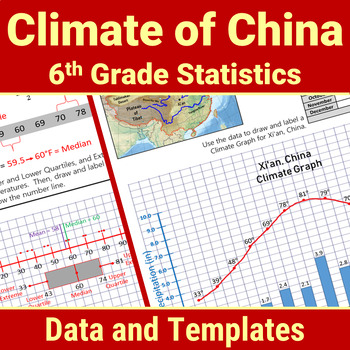
China Geography 6th Grade Statistics Box Plot Histogram Mean Median Activity
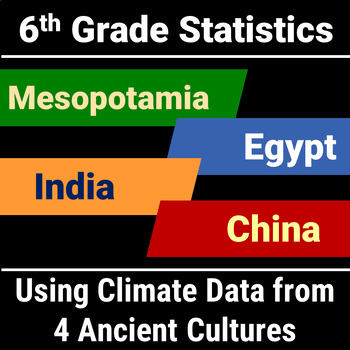
Enrich your study of Ancient China using 6th Grade statistics and Probability skills to analyze China climate data. Calculate Measures of Central Tendency (mean, median, mode, range) and Mean Absolute Deviation. Master Data Display with Box and Whisker Plots, Histograms, Dot Plots, Stem and Leaf Charts. Write Statistical Questions. Analyze Data Distribution and Data Variability.All with climate data (temperature and precipitation) from China!This Print and Go STEM/STEAM PBL resource includes 70
Preview of 6th Grade Statistics Project Activity with Climate Data from 4 Ancient Cultures
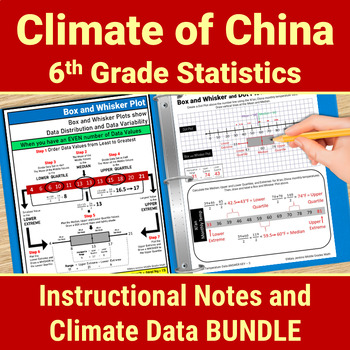
6th Grade Statistics Project Activity with Climate Data from 4 Ancient Cultures

Enrich your geography study of ancient cultures using 6th Grade Statistics and Probability skills to analyze climate data. Calculate Measures of Central Tendency (mean, median, mode, range) and Mean Absolute Deviation. Master Box and Whisker Plots, Histograms, Dot Plots, Stem and Leaf Charts. Write Statistical Questions. Analyze Data Distribution and Data Variability. Apply climate analysis to ancient settlement patternsAnswer the "how will I use this math" question!If you also teach Greece and
Preview of China Geography 6th Grade Statistics Mean Median Mode Range Box Plot Activity
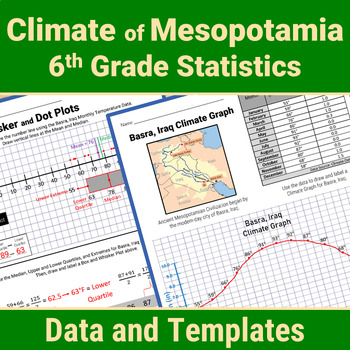
China Geography 6th Grade Statistics Mean Median Mode Range Box Plot Activity

Enrich your study of Ancient China using 6th Grade stats skills to analyze China climate data. Master Data Display with Box and Whisker Plots, Histograms, Dot Plots, Stem and Leaf Charts. Calculate Measures of Central Tendency (mean, median, mode, range) and Mean Absolute Deviation. Write Statistical Questions. Analyze Data Distribution and Data Variability.All with climate data (temperature and precipitation) from China!This Print and Go STEM/STEAM PBL resource includes 120 pages of Instruction
Preview of Mesopotamia Geography 6th Grade Statistics Box Plot Mean Median Mode Activity
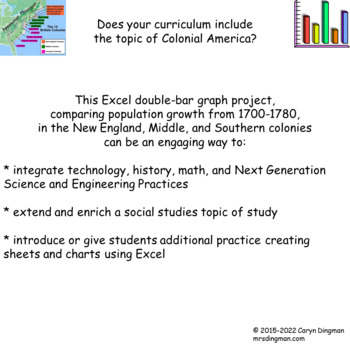
Mesopotamia Geography 6th Grade Statistics Box Plot Mean Median Mode Activity

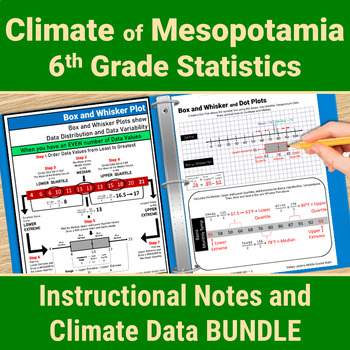
Enrich your study of Mesopotamia using 6th Grade stats skills to analyze Mesopotamian climate data. Calculate Measures of Central Tendency (mean, median, mode, range) and Mean Absolute Deviation. Master Data Display with Box and Whisker Plots, Histograms, Dot Plots, Stem and Leaf Charts. Write Statistical Questions. Analyze Data Distribution and Data Variability.All with climate data (temperature and precipitation) from Iraq and Turkey!This Print and Go STEM/STEAM resource includes 70+ pages of
Preview of Excel Graphing 13 Colonies Population Growth with Digital Student Directions
Excel Graphing 13 Colonies Population Growth with Digital Student Directions

Created by
Caryn Dingman
Does your curriculum include a study of Colonial America? This Excel double-bar graph project, comparing population growth from 1700-1780, in the New England, Middle, and Southern colonies, can be an engaging way to:* integrate technology, history, math, and Next Generation Science and Engineering Practices* extend and enrich a Social Studies unit of study* introduce or practice having students create sheets and charts using ExcelProject file includes:* teacher notes/ classroom management sugges
Preview of Mesopotamia Geography 6th Grade Statistics Mean Median Mode Box Plot Activity
Mesopotamia Geography 6th Grade Statistics Mean Median Mode Box Plot Activity

Enrich your study of Mesopotamia using 6th Grade stats skills to analyze Mesopotamian climate data. Master Data Display with Box and Whisker Plots, Histograms, Dot Plots, Stem and Leaf Charts. Calculate Measures of Central Tendency (mean, median, mode, range) and Mean Absolute Deviation. Write Statistical Questions. Analyze Data Distribution and Data Variability.All with climate data (temperature and precipitation) from Iraq and Turkey!This Print and Go STEM/STEAM PBL resource includes 120 pages
Preview of Middle School Survey Statistics Project Bundle
Middle School Survey Statistics Project Bundle

DescriptionA bundle of all materials needed for my Middle School Survey Project! Perfect for an end of year or statistics unit project.A fun, engaging, and active way for students to explore the foundations of statistical analysis and modeling.In this project students are tasked with creating a statistical question, surveying two relevant populations, calculating the measures of center and variability, making a dot plot, histogram, and box-and-whisker plot, and analyzing their data.Included in t
Preview of Identifying and Writing Statistical Questions and Ways to Collect Data 6.SP.A.1
Identifying and Writing Statistical Questions and Ways to Collect Data 6.SP.A.1

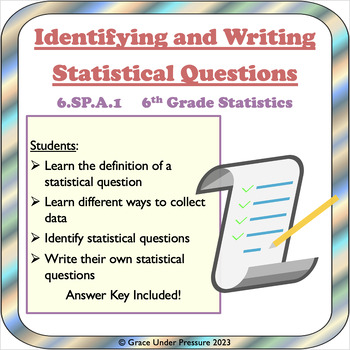
This lesson is perfect for your 6th Grade Statistics Unit and it specifically addresses CCS Standard 6.SP.A.1Students:- Learn the definition of a statistical question: a question that has numerical answers that vary- Learn different ways to collect data (survey, measure, use previously collected data, observe)- Identify statistical questions (8 questions are listed and 5 of them are statistical)- Write their own statistical questions (students write 3 statistical questions and 1 that is not and
Preview of Rome Geography 6th Grade Statistics Box Plot Histogram Mean Median Mode Activity
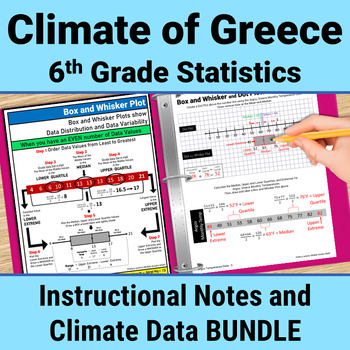
Rome Geography 6th Grade Statistics Box Plot Histogram Mean Median Mode Activity

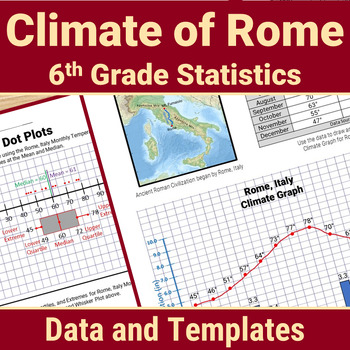
Enrich your study of Ancient Rome using 6th Grade stats skills to analyze Italy climate data. Calculate Measures of Central Tendency (mean, median, mode, range) and Mean Absolute Deviation. Master Data Display with Box and Whisker Plots, Histograms, Dot Plots, Stem and Leaf Charts. Write Statistical Questions. Analyze Data Distribution and Data Variability.All with climate data (temperature and precipitation) from Rome!This Print and Go STEM/STEAM PBL resource includes 70+ pages of climate data
Preview of Greece Geography 6th Grade Statistics Mean Median Mode Range Box Plot Activity
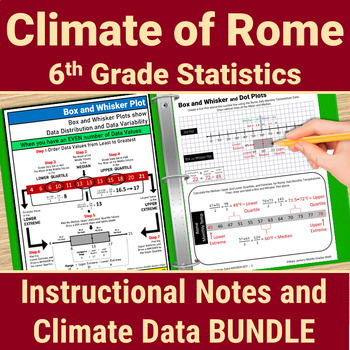
Greece Geography 6th Grade Statistics Mean Median Mode Range Box Plot Activity

Enrich your study of Ancient Greece using 6th Grade statistics skills to analyze Greek climate data. Master Data Display with Box and Whisker Plots, Histograms, Dot Plots, Stem and Leaf Charts. Calculate Measures of Central Tendency (mean, median, mode, range) and Mean Absolute Deviation. Write Statistical Questions. Analyze Data Distribution and Data Variability.All with climate data (temperature and precipitation) from Greece!This Print and Go STEM/STEAM PBL resource includes 120 pages of Inst
Preview of Rome Geography 6th Grade Statistics Mean Median Mode Box Plot Histogram Activity
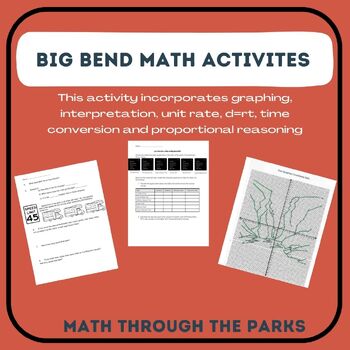
Rome Geography 6th Grade Statistics Mean Median Mode Box Plot Histogram Activity

Enrich your study of Ancient Rome using 6th Grade Statistics and Probability skills to analyze Italy climate data. Master Data Display with Box and Whisker Plots, Histograms, Dot Plots, Stem and Leaf Charts. Calculate Measures of Central Tendency (mean, median, mode, range) and Mean Absolute Deviation. Write Statistical Questions. Analyze Data Distribution and Data Variability.All with climate data (temperature and precipitation) from Rome!This Print and Go STEM/STEAM PBL resource includes 120 p
Preview of Big Bend Math: Graphing, Converting time, D=Rt, Unit Rate & Coordinate Graph
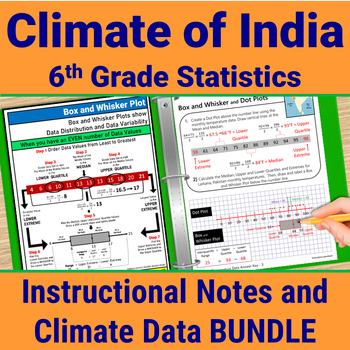
Big Bend Math: Graphing, Converting time, D=Rt, Unit Rate & Coordinate Graph

Hiking Big BendThis activity incorporates the following skills:· Converting minutes to hours and hours to minutes· Unit rate· Graphing and Interpreting· Unit Rate· D=RT· Real world application· Proportional Reasoning Calculating Distance Based on teacher preference you can answer for answers in hours and minutes or just minutes. The answer sheet includes both answers. Also, you can access the actual Big Bend map on the NPS website. This activity incorporates the following skills:· Converting m
Preview of India Geography 6th Grade Statistics Mean Median Mode Range Box Plot Activity

India Geography 6th Grade Statistics Mean Median Mode Range Box Plot Activity

Enrich your study of India using 6th Grade stats skills to analyze India climate data. Master Data Display with Box and Whisker Plots, Histograms, Dot Plots, Stem and Leaf Charts. Calculate Measures of Central Tendency (mean, median, mode, range) and Mean Absolute Deviation. Write Statistical Questions. Analyze Data Distribution and Data Variability.All with climate data (temperature and precipitation) from ancient Indian sites!This Print and Go STEM/STEAM PBL resource includes 120 pages of Inst
Showing 1-19 of 19 results

Find Social Studies - History resources | TPT

Importance of learning social studies

Social studies offers valuable insights into history, geography, and much more. Social studies captivates students by providing them with perspectives from the past, present, and future, allowing them to understand history and navigate current events. It enables them to appreciate how previous generations have shaped their present reality. In essence, social studies opens their eyes to the vastness of life beyond their immediate surroundings.

Benefits of learning social studies

Learning social studies offers many benefits to students in terms of helping them develop a holistic understanding of the world. Namely, it helps them:

  • Learn about the achievements, challenges, perspectives, traditions, and customs of different societies
  • Evaluate information, analyze evidence, and make informed judgments about complex social, economic, and political issues
  • Become active, responsible, and engaged citizens
  • Comprehend global issues such as human rights, environmental sustainability, and economic disparities

By teaching social studies, teachers can help students develop critical thinking skills, foster civic engagement, and promote social awareness and responsibility.

Teaching with social studies resources

On TPT, social studies resources come in various formats, from worksheets to interactive notebooks to units. They can be used to enhance learning, assess a student’s mastery of social studies concepts, or to reteach a tricky topic. With plenty of TPT resources at your fingertips, teaching and learning social studies will be so much easier.

Discover printable and digital social studies resources

If you’re a teacher or parent looking for printable or digital social studies resources, TPT has an extensive array of instructional materials for every learning need, topic, or grade level. Whether you’re teaching students about America’s democratic process, the legacy of Dr. Martin Luther King, Jr., how to read maps, or World War II, we’ve got you covered.

Social studies resources on TPT offer informative lessons, engaging texts, intriguing facts, interactive puzzles, and enjoyable trivia games. These grade-specific resources ensure that all students can access age-appropriate materials that stimulate their minds and enhance their creative thinking abilities.

For instance, first graders can explore worksheets on senses and emotions, followed by a coloring page featuring Harriet Tubman. Older students can test their knowledge with quizzes on statistics and capital cities, then delve into the history of the Underground Railroad through an informational sheet or enjoy a word search focused on civil rights leaders. With such a wide variety of subjects and topics covered, our social studies pages provide endless opportunities for students to explore the world in captivating ways.

Frequently asked questions about teaching social studies

What types of social studies lessons are available on TPT?

There are many different types of history resources sold by Sellers on TPT. Some popular social studies lessons include U.S. history, world history, ancient history, geography, civics, and government.

How do I find social studies lessons on TPT?

Educators can save time preparing history lessons with resources created by experienced teachers. Simply start a search for social studies resources on the TPT marketplace, and filter by grade level, price, and/or resource type to find materials that've been proven to work in classrooms like yours. No matter what you’re teaching, there are plenty of social studies lessons and activities sold by Sellers on TPT that are tailored to meet your students' skill levels.