50 results
Applied math Common Core HSS-ID.A.3 resources
Statistics: FULL CURRICULUM BUNDLE
Statistics: Full Curriculum This is the FULL CURRICULUM bundle for my regular-level, Statistics course. If you are looking for my full curriculum for AP Statistics, follow the link here. This full curriculum is six units long and lasts 1 semester, approximately 90 school days. The following units are included in this bundle: Unit 1 – One-Variable DataUnit 2 – The Normal DistributionUnit 3 – Two-Variable DataUnit 4 – Collecting DataUnit 5 – ProbabilityUnit 6 – Random Variables Each unit contains
Subjects:
Grades:
11th - 12th
Types:
CCSS:
Statistics: One Variable Data
StatisticsUnit 1: One Variable Data A complete unit bundle for a high school statistics course. Welcome! This is the complete unit plan for the first unit in my regular level Statistics class. (If you are interested in the AP Statistics Unit 1 Plans, check out my listing here.) Included in this resource: 9 complete sets of student guided notes (annotated answer keys included)9 homework problem sets + complete test review (annotated answer keys included)3 assessments – 2 quizzes and test (answer
Subjects:
Grades:
10th - 12th
Types:
CCSS:
Also included in: Statistics: FULL CURRICULUM BUNDLE
Measures of Center & Variance Unit Bundle - Distance Learning Compatible
This is a selection of my Measures of Center & Variance resources all in a money saving Essential Bundle! You save significant money and time versus purchasing these separately!Essential Bundles are designed to give you everything you need to rock your unit. Warmups, Notes, Activities, Games, Exit Tickets, and Tests. You will find a selection of my Drive Instruction, Escapes, Boot Camp, Adventures, Whodunnits, CSI, Person Puzzles, STEM-ersions, Herowork, TableTop and my 21st Century Math Pro
Subjects:
Grades:
6th - 12th
Types:
Statistics: Sampling Distributions
StatisticsUnit 7: Sampling DistributionsThis complete unit bundle teaches students all about the normal probability distribution, the sampling distribution for a sample proportion, the Central Limit Theorem, and the sampling distribution for a sample mean.Included in this resource:3 complete sets of student guided notesPowerPoint presentations of all the notes for easy and seamless class instruction5 homework problem sets + complete test review2 assessments – quiz and testAn in-class review less
Subjects:
Grades:
11th - 12th
Types:
CCSS:
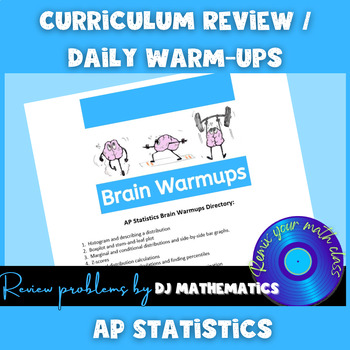
AP Statistics Curriculum Review / Daily Warmups
Introducing the Ultimate AP Statistics Resource!Unlock the potential of your AP Statistics students with a meticulously crafted resource, designed to engage and challenge them while aligning perfectly with the AP Statistics curriculum. Created by a seasoned teacher who achieved a remarkable 80% success rate in guiding students to earn 5's on the AP Statistics exam, this resource is a game-changer for any AP Statistics classroom.What sets this resource apart? It's the infusion of current culture
Subjects:
Grades:
9th - 12th
Types:
CCSS:

Normal Distribution in a real life context: Lake Tekapo Fish Mongers
Are you having trouble explaining what Normal distribution is and how it can be used in real life? Are your students craving a hands on activity that would make sense of this concept? Do you need an engaging project on statistics? Would you like an activity that already has enrichment, scaffolding and all of the material ready to go? If you answered yes to any or all of these questions, this project is tailor made for you!Your students will assume a role of a research team for a fishing company.
Subjects:
Grades:
10th - 12th, Higher Education
Types:
CCSS:
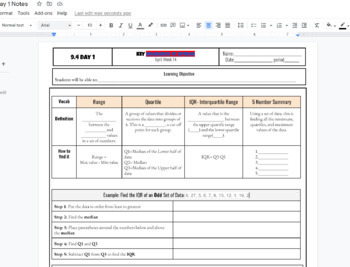
IQR interquartile Range and 5 number summary box and whisker plot Notes
IQR interquartile Range and 5 number summary box and whisker plot Notes including Q1, Q2, Q3, Min and Max and step by step both examples of finding the IQR and creating a box and whisker plot. Used in HS math 1 class WITH KEY INCLUDED AS a link to a printable PDF
Subjects:
Grades:
7th - 12th, Higher Education, Adult Education
CCSS:
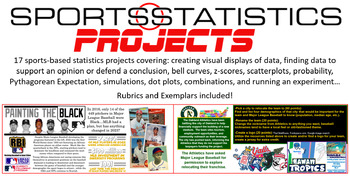
Sports Statistics - Projects ONLY! 17 projects in all
Most of the projects allow students to choose their own topic to display their understanding of statistical topics. Students will:Create a graph of their choosing given dataDesign an infographic on the subject of their choosingResearch and defend their G.O.A.T. choice in a variety of categoriesUse demographics to relocate and rebrand a professional franchiseResearch social injustices in sports and display the dataCreate a bell curve based on career statistics of Michael JordanCompare the salari
Subjects:
Grades:
8th - 12th
CCSS:
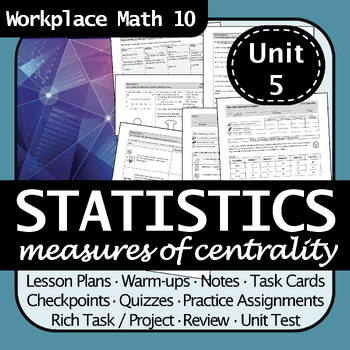
Statistics Unit Workplace Math 10 | Engaging, Differentiated, No Prep Needed!
Are you searching for a thorough, engaging, and differentiated unit plan for statistics and measures of centrality (mean, median, mode, range)? Then this resource is for you!This thoughtfully constructed unit is designed to bring math to life, ensuring an enriching learning experience for your students whether you’re in the classroom, at home, or distance learning. No prep necessary - everything you need to teach the entire unit is in the package (including resources for teachers such as a paci
Subjects:
Grades:
7th - 11th
Types:
CCSS:
AP Stat Unit 1,2,3 Describing Data, Linear Regression, Experiments/Sampling
This bundle includes complete guided notes, homework, and editable quizzes for the first 3 units of AP Statistics. The bundle also includes three FBI Most Wanted activities to use with the units and an activity to use with students during the first few weeks of school.
Subjects:
Grades:
9th - 12th
Types:
CCSS:
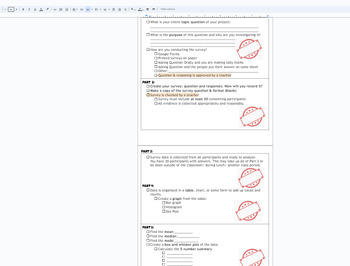
Statistics Survey project Discovery (broken down into sections) with Rubric
This is a broken down (scaffolded) packet of instructions/ guide for a Stats Project for Math 1 HS or 8th grade students. The goal of the project is for students to take a statistical survey on quantitative data (numbers) of their choice. Using this data from the survey, the following will be included in the project:Survey- the question being askedSurvey responses (requirement of 30)Data organization: Bar chart, Histogram, Dot PlotMeanMedianModeBox and Whisket Plot5 number summary (Q1,Q2,Q3, min
Subjects:
Grades:
7th - 12th, Higher Education, Adult Education
CCSS:
![Preview of Data Distribution Quiz [2 Versions with Keys]](https://ecdn.teacherspayteachers.com/thumbitem/Data-Distribution-Quiz-2-Versions-with-Keys--11525333-1714672656/original-11525333-1.jpg)
Data Distribution Quiz [2 Versions with Keys]
This is a seven-question quiz on data distribution. One problem assesses finding the mean and quartile cutoff values from a frequency table. The other assesses using the z-score and normal distribution to find the percentile of data values.Problems are broken down into smaller questions that build into the overall skills.Two versions of the quiz are included in the file. An answer key for both versions is included.
Subjects:
Grades:
11th - 12th
Types:
CCSS:
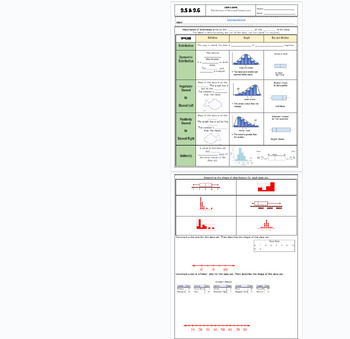
Data Distribution positive/negative skewed fillable notes UPDATED
Unit 9: Data and Stats: Updated(No 9.3/ Skip)9.5/9.6 Data Distribution (skewness)Students go over the vocabulary and complete the examples with the vocabulary scaffolded. Skewness is explained and how to identify it comparing data charts and box and whisker plots. Uses many visuals and examples to differentiate between that different graphs. Notes are scaffolded. Includes hook video hyperlinked on the "learning objective" title. Key is included and hyperlinked as a PDF in the heading highlighted
Subjects:
Grades:
6th - 12th, Higher Education, Adult Education
CCSS:
Also included in: Unit 9: Data and Statistics Fillable Notes

Middle School Entrepreneurship: Interactive Team-Based Business Simulation Game
Introduce Students to Business Creation & Entrepreneurship in the Startup Game Simulation. In The Startup Academy Game, students are exposed to some of the decisions that they will have to make as a business owner. They will be simulating the first 12 weeks of a business startup that is selling cupcakes. The goal of the game is to be the team that builds the business with the greatest worth by the end of the 12 weeks. Students will make decisions each turn that will determine how much money
Subjects:
Grades:
6th - 10th
Types:
CCSS:
Data and Statistics (DS) Bundle
Shape, center and spread, the normal distribution, sampling and linear regression are all explored in this introduction to statistics. These missions are aligned with Common Core Standards from the Statistics and Probability category for 8th grade and high school.
The fun stuff:
Heart rates and marathons, coins and NBA heights, this bundle gives students the chance to explore shape, center, and spread with coins, dice, heights, shoe sizes and more. They also explore linear regression and even
Subjects:
Grades:
7th - 12th
CCSS:

Unit 9: Data and Statistics Fillable Notes
Unit 9: Data and Stats(No 9.3/ Skip)9.1 Central Tendencies: Mean, Median and Mode9.2 Graphical Data: Bar Charts, Dot Plots and Histograms9.3 NONE9.4A 5 number summary and box and whisker plots 9.4B Standard Deviation9.5/9.6 Data Distributions (skewness) left or right9.7 Frequency Tables and relative frequency tablesStudents go over the vocabulary and complete the examples with the vocabulary scaffolded. Notes are scaffolded. Includes hook video hyperlinked on the "learning objective" title. Key
Subjects:
Grades:
6th - 12th, Higher Education, Adult Education
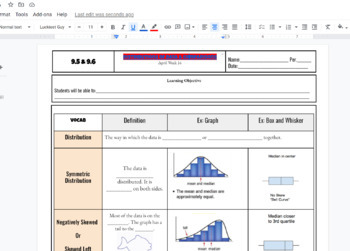
Distributions of Data Scaffolded Fillable Notes (Skewed Left & right) w/ KEY
Distributions of Data Scaffolded Fillable Notes (Skewed Left & right) Includes a problem of creating box plot, bar chart, and dot plot. KEY IS INCLUDED linked at top of title highlighted in red!!! , Algebra 1 or Math 1 class in highschool setting IEP 504 EL learners visuals for better understanding. YOU CAN EDIT THE GOOGLE DOC to your liking!!!
Subjects:
Grades:
7th - 12th, Higher Education, Adult Education
CCSS:
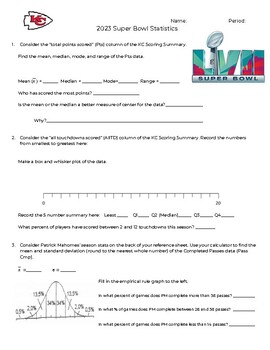
2023 Super Bowl Statistics Activity
This activity contains two stats sheets - one for the Philadelphia Eagles and one for the Kansas City Chiefs. Students are asked to use the data from the various tables to answer questions about the teams. This activity covers 1 variable statistics (mean, median, mode, range, standard deviation, box-and-whisker plot, histogram, two-way tables).This would be great as a partner activity or class activity.
Subjects:
Grades:
7th - 12th
Types:
CCSS:
Standard Deviation Fillable Notes UPDATED
Unit 9: Data and Stats: Updated(No 9.3/ Skip)9.4 B Standard DeviationStudents go over the vocabulary and complete the examples with the vocabulary scaffolded. Standard deviation is long hand calculated by showing each step of the process (difference of squares). Real-world examples are explained in notes before calculating to show the importance of this stat and why it is used so often to verify valuable and effective data. Notes are scaffolded. Includes hook video hyperlinked on the "learning o
Subjects:
Grades:
7th - 12th, Higher Education, Adult Education
CCSS:
Also included in: Unit 9: Data and Statistics Fillable Notes
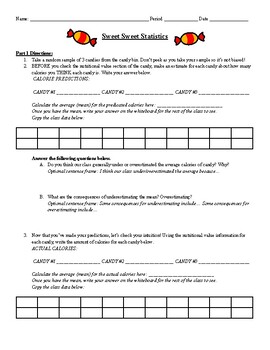
Halloween / Fall Statistics Class Activity for Box Plots and Five Number Summary
Hello!If you're looking for a fun and engaging activity for your Statistics Class this Halloween or fall season, this activity is great! My students enjoy getting the opportunity to eat candy as they work on some real-world statistical applications. The activity requires students to collect data, share data with their peers, and analyze the data. They will be working on creating a five number summary and analyzing/drawing box plots. You will need to purchase candy for this activity. Please reach
Subjects:
Grades:
9th - 12th, Higher Education
CCSS:
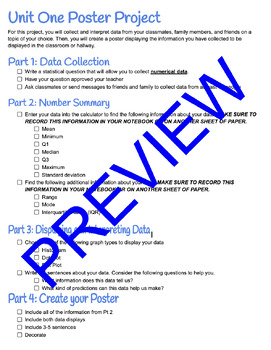
One Variable Stats Numerical Data Poster Project
This project focuses on one variable numerical data. Students are asked to come up with their own numerical question and then act as statisticians to collect and analyze the data from at least 15 other people. Students are asked to create a histogram, box plot, and dot plot to represent the data and are asked to write summary sentences analyzing what their data shows. Included is a project checklist, rubric, and planning page for each student.
Subjects:
Grades:
6th - 12th
Types:
CCSS:
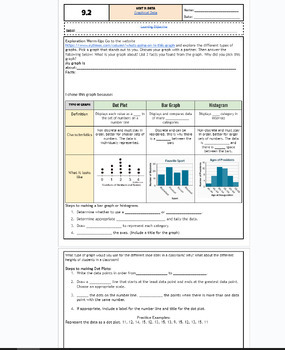
Graphical Data: Bar Charts, Dot Plots and Histograms fillable notes UPDTD
Unit 9: Data and Stats: UpdatedUpdated9.2 Graphs: bar, dot plot, histpgramStudents go over the vocabulary and define each type fo graph and what data fits for each graph. The warm up is an exploratory activity where students go on a website to search for their graph of interest and discuss the key findings. This takes around 10-15 mins and students enjoyed it! Notes are scaffolded. Includes hook video hyperlinked on the "learning objective" title. Key is included and hyperlinked as a PDF in the
Subjects:
Grades:
6th - 12th, Higher Education, Adult Education
CCSS:
Also included in: Unit 9: Data and Statistics Fillable Notes
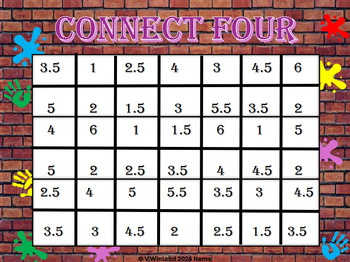
Connect Four ( Statistics)
Statistics Connect FourConnect four by rolling dice and finding averages.Students have to keep track of frequency and relative frequency.Also create a histogram and decide if frequencies create a uniform, normal curve or skewed curve.
Subjects:
Grades:
10th - 12th, Higher Education, Adult Education
Types:
CCSS:
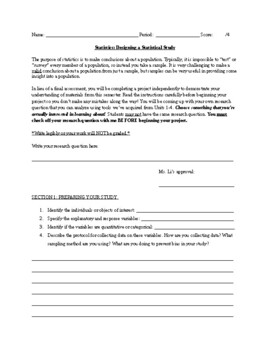
Statistics Project: Regressions + Designing a Statistical Study for High School
Hello!I've designed a statistics project that students in my class loved! This project requires students to go collect data on a topic that interests them. They have to design a sampling method that is as unbiased as possible. Students are then required to analyze their data and summary statistics. They also need to do a regression analysis on their study and make inferences using their results. This is perfect for a replacement of a test or as an end-of-semester project for students. Perfect fo
Subjects:
Grades:
9th - 12th, Higher Education
Types:
CCSS:
Also included in: AP Statistics / High School Statistics Projects
Showing 1-24 of 50 results


