27 results
Graphing Common Core HSS-ID.A.3 resources
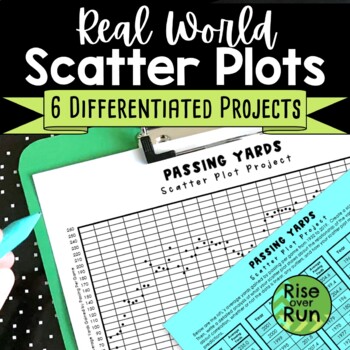
Scatter Plot Project with Real World Sports Data
Practice creating and analyzing scatter plots with these six differentiated real world projects. Students are provided statistics for a sport and must graph the data. Then, they write an analysis describing correlation, whether or not the data is linear, any outliers, and how the scatter plot might be used to make predictions. The scatterplots range from 38 points to 149 points, so they can be used to differentiate. The scatter plots will take a little time to plot, but they result in real
Subjects:
Grades:
8th - 9th
Types:
CCSS:
Also included in: 8th Grade Math Activities & Lessons Bundle for the Whole Year
Algebra 1 Curriculum
Get a complete High School Algebra 1 curriculum including units on solving equations and inequalities, linear functions, exponents and exponential functions, factoring polynomials, quadratics, and more! These ready-to-use Algebra 1 resources include everything you need to teach high school algebra to your on-level or lower-level/special education class. Supplements would be needed for an honors class.Each unit contains guided notes, practice worksheets for the classroom and/or homework, activiti
Grades:
8th - 11th
CCSS:
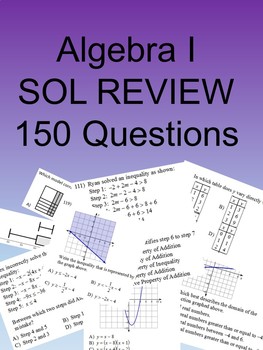
Algebra I 150 Multiple Choice SOL type questions
I have recently updated this product so that it is editable and has an easier to read format. In addition to a pdf you will receive a docx file that has the questions as images. You can delete questions, rearrange, or insert your own questions. 150 mostly multiple choice questions with a few multiple answers and free response as well similar to questions from the Virginia SOLs. Questions cover the entire algebra I curriculum. Use as Final Exam review or SOL Review.There are at least two que
Grades:
7th - 10th
CCSS:
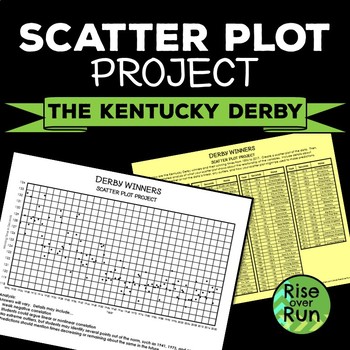
Scatterplot Project with Real World Stats from the Kentucky Derby
Practice creating and analyzing scatter plots with this project. Students are provided statistics for winning horses and must graph the data. Then, they write an analysis describing correlation, whether or not the data is linear, any outliers, and how the scatter plot might be used to make predictions. This is one of the projects in my Differentiated Scatter Plot Projects!Thank you for your interest in this resource from Rise over Run. Related Resources:Scatter Plot Practice WorksheetsScatter
Grades:
8th - 9th
Types:
CCSS:
Also included in: Algebra I Sub Plans Bundle with Activities

Statistics Survey Project - Project Based Learning (PBL) with Math
Watch your students dive into the world of math as they create, execute, and analyze their own survey! Students will demonstrate mastery of data gathering, survey sampling, developing appropriate survey questions, data tables, Direct Variation, discrete graphs, dot plots, box and whisker graphs, and calculating the inter-quartile range.The Unique Survey Project is highly engaging, capitalizing on the innate curiosity of the adolescent mind. You will love the low-prep instructional guide. Your st
Subjects:
Grades:
6th - 10th
Types:
Also included in: Fun with Ratios Activities Bundle - 7th Grade PBL with Math
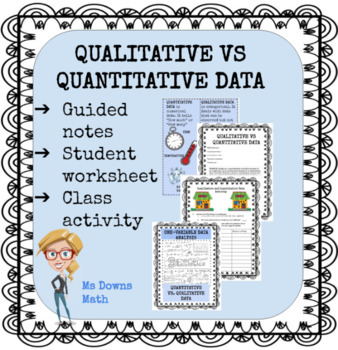
Qualitative vs Quantitative Data
This lesson provides notes as well as a note taking guide and exercise for students. There is also a class activity meant to get students thinking about how we graph different types of data. Students usually have no trouble with the categorical data, but sometimes get stumped as to how to graph the numerical data. With a little motivation, they can usually come up with a dot plot or stem and leaf plot if they are familiar with that type of graph. This is a fun activity for students as they are g
Subjects:
Grades:
7th - 12th
Types:
CCSS:
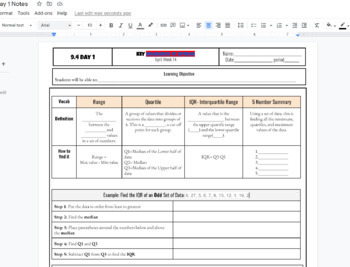
IQR interquartile Range and 5 number summary box and whisker plot Notes
IQR interquartile Range and 5 number summary box and whisker plot Notes including Q1, Q2, Q3, Min and Max and step by step both examples of finding the IQR and creating a box and whisker plot. Used in HS math 1 class WITH KEY INCLUDED AS a link to a printable PDF
Subjects:
Grades:
7th - 12th, Higher Education, Adult Education
CCSS:

Fun with Ratios Activities Bundle - 7th Grade PBL with Math
The purpose of the Fun with Ratios Activities Bundle is to give students the opportunity to use creativity to apply ratios, proportions, and percentages in real-world settings. This bundle includes three unique tasks: Black Friday Mastery Task, Direct Variation Poster Mastery Task, and the Unique Survey Project. These activities and their accompanying materials are suited for students in grades 7 through 9. These lessons make excellent sub plans. Each project takes approximately two 60-minute bl
Subjects:
Grades:
7th - 9th
Types:
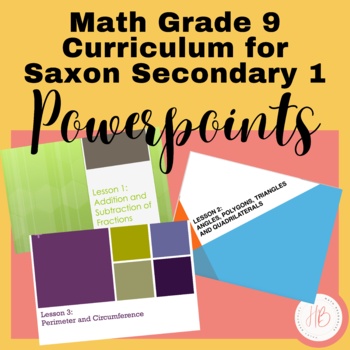
9th Grade Saxon Secondary 1 Math Powerpoints
These 120 Powerpoint lessons work hand in hand with the Saxon Algebra 1 math textbook. If you do not teach the Saxon program then these Powerpoints can be used to help teach the Secondary 1 Common Core. Each Powerpoint consists of a lesson overview which includes formulas and direct instructions. After that there are several practice problems that allows students to put into practice what they just learned. This is a great opportunity for group work as well as for the teacher to walk around the
Grades:
8th - 9th
Types:
CCSS:
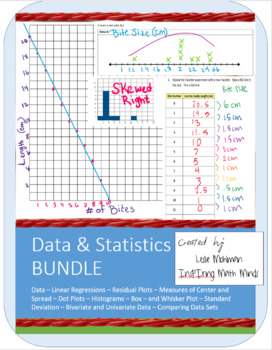
Bundle: Data and Statistics Unit and Twizzlers Project
This bundle includes a 5 lesson unit and a 5 part project.The project, students collect data, create graphs: scatterplots, dot plots, histograms, box-and-whisker plots. They analyze bivariate data by drawing lines of best fit, finding the correlation coefficient, linear regressions, and residual plots. They analyze univariate data looking at its shape (symmetric or skewed) and calculating the appropriate centers and spreads. With this fast and easy method of data collection, students each get
Subjects:
Grades:
7th - 12th
Types:
CCSS:
6th-9th Grade Gummy Bear Math Activity- Data and Statistics
This is a fun (and yummy) Math activity created to review data and statistics concepts from 6th grade. Fun test practice/review! It can also be used as review or instruction for 7th-9th grades.You WILL need to buy gummy bears! Students will sort and count, then compare their bears with others.This is printable. But, included in the download is an editable Google Doc. Also, I have included a grading rubric and vocabulary sheet that can be printed for student binders/notebooks.Concepts covered:Me
Subjects:
Grades:
6th - 9th
Types:
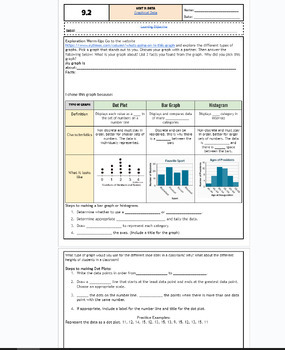
Graphical Data: Bar Charts, Dot Plots and Histograms fillable notes UPDTD
Unit 9: Data and Stats: UpdatedUpdated9.2 Graphs: bar, dot plot, histpgramStudents go over the vocabulary and define each type fo graph and what data fits for each graph. The warm up is an exploratory activity where students go on a website to search for their graph of interest and discuss the key findings. This takes around 10-15 mins and students enjoyed it! Notes are scaffolded. Includes hook video hyperlinked on the "learning objective" title. Key is included and hyperlinked as a PDF in the
Subjects:
Grades:
6th - 12th, Higher Education, Adult Education
CCSS:
Also included in: Unit 9: Data and Statistics Fillable Notes

6 Editable Bar Graph Templates 2.0
Finally a simple and professional graph space that students can fill out without any design issues getting in the way. This file contains 6 ready-to-use graph options. Print them and have students fill them with pencil and ruler, or distribute them over computer and let them practice entering the data. Get a project perfect finish every time. Maybe you just want to fill it out live on a projector? The possibilities are endless! It's okay to say you love these bar graphs. So do we.Contains:- 2 bl
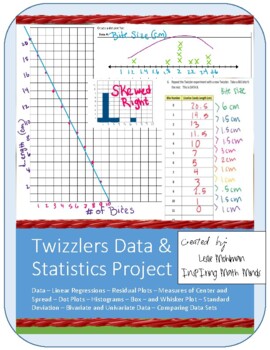
Twizzlers Data and Statistics Project in 5 Parts
In this project, students collect data, create graphs: scatterplots, dot plots, histograms, box-and-whisker plots. They analyze bivariate data by drawing lines of best fit, finding the correlation coefficient, linear regressions, and residual plots. They analyze univariate data looking at its shape (symmetric or skewed) and calculating the appropriate centers and spreads. With this fast and easy method of data collection, students each get their own data and most students will get one set of d
Subjects:
Grades:
7th - 12th
Types:
CCSS:
Also included in: Bundle: Data and Statistics Unit and Twizzlers Project
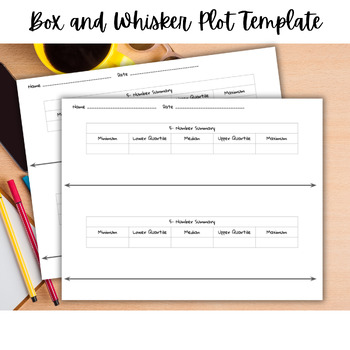
Box Plot Template | Box and Whisker Plot Template | Graphing Template
Box and Whisker Plot TemplateSay goodbye to data confusion and hello to organized insights with our Box Plot Template! This tool simplifies data organization with a five-number summary and a ready-to-use number line, so students can jump right into visualizing data distributions.With two box plots on one paper, students can easily compare data, spot outliers, identify medians, quartiles, and more - all at a glance!
Subjects:
Grades:
8th - 12th
CCSS:
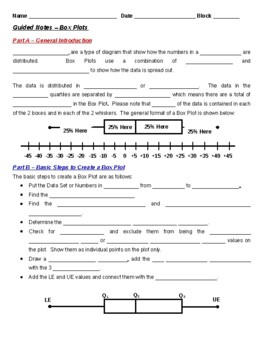
Guided Notes - Box Plots (Student & Teacher Versions)
This MS Word file is a Guided Notes document that reviews both the concept and steps involved in solving and producing Box Plots. I use these notes with my Math 1, Math 2 and Algebra 1 students immediately after I introduce this concept with my PPT presentation slidepack on the same subject. It is 2 full pages of notes for the students to complete and includes the detailed steps that I teach my students to use to solve and produce Box Plots. The 3rd page includes an example problem that is wo
Subjects:
Grades:
8th - 10th
CCSS:
The Normal Distribution (DS3): HSS.ID.A.3
Students will explore the normal distribution through real-world examples and the binomial distribution as number of experiments increases. Students will connect frequency plots to their corresponding probability distributions, and explore the shape, center and spread with the mean and provided standard deviation. This mission is aligned with Common Core State Standards: HSS.ID.A.3.
The fun stuff:
Candies, NBA players and sodas! But especially candies--the kids will take samples of candies in o
Subjects:
Grades:
7th - 12th
CCSS:
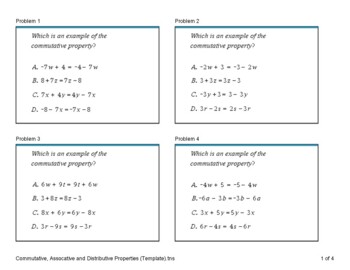
Algebra 1 Workbook (2020)
This Algebra 1 file contains 8 question or 16 question or 24 question practice problems and 16 questions chapter review tests. This was created to help out teachers looking for quality resources with answer keys.Topics:1 - Expressions and Equations2 - Inequalities3 - Domain and Range4 - Linear Equations5 - Exponents6 - Radicals7 - Systems8 - Polynomial Arithmetic9 - Polynomial Graphs10 - Regression Analysis11 - Statistics
Grades:
7th - 12th
Types:
CCSS:
Also included in: Algebra and Geometry Workbook and TI-84/TI-Nspire Step
Sampling (DS4): HSS.ID.A.2
Students will explore samples and statistics using real world data. They will take multiple samples from a roughly normally distributed population and observe that the samples statistics are normally distributed with a mean close to the population mean. This mission is aligned with Common Core State Standards: HSS.ID.A.2.
The fun stuff:
Candies, NBA players and sodas! But especially candies--the kids will take samples of candies in order to build a roughly normal distribution. Yum! Tasty treats
Subjects:
Grades:
8th - 10th
CCSS:
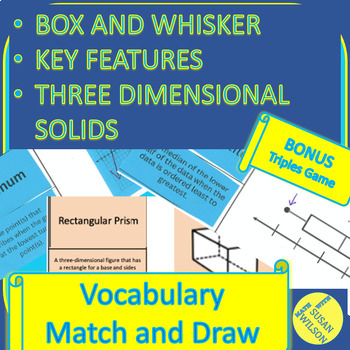
Vocabulary Bundle- Key Features, Box and Whisker, and Three Dimensional Solids
Do you need your students to use the correct Math vocabulary? This bundle includes three math vocabulary activities- key features, box and whisker, and three dimensional figures. Each Match and Draw activity has your students associate term, definition, and picture.BONUS: Three Dimensional Solids Triple Match GameAvailable only in this Bundle!
Grades:
6th - 11th
Types:
CCSS:
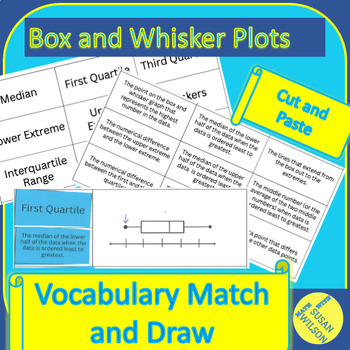
Box and Whisker Vocabulary Match and Draw
Do you need an activity to help students with the vocabulary of Box and Whisker plots? This match and draw activity has students match the term and definition and then make sense of the definition to create a drawing. The finished product will make great notes for your students to add to their notebook to study. The provided answer key will help you grade the work quickly.Vocabulary Included:MedianFirst QuartileThird QuartileLower ExtremeUpper ExtremeWhiskersInterquartile RangeRangeOutlier Yo
Subjects:
Grades:
7th - 10th
Types:
CCSS:
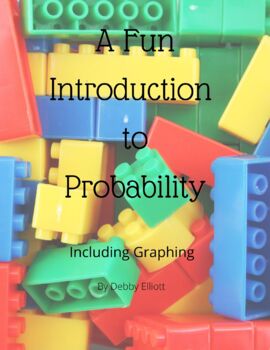
A Fun Introduction to Probability
This product contains fourteen pages that introduce probability by graphing the LEGOs and comparing the number of studs on LEGO bricks. These statistics will be figured in fractions, decimals and percentages. Graphing will be done on bar graphs and pie graphs. The worksheets are colorful and engaging for students. Students will learn to find the mean, median and mode of different numbers of studs on LEGO bricks. Students will find their own statistics and combine them with the statistics of ot
Subjects:
Grades:
4th - 9th
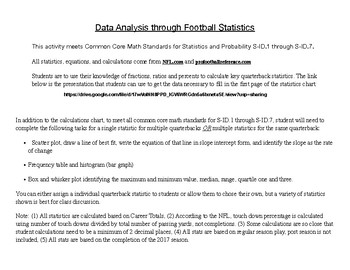
Statistical Analysis using Football (Quarterback) Stats
Are your students interested in football? Get them excited about math and statistics while pursuing hall of fame quarterbacks.This project covers Common Core Math Standards for S-ID.1 through S-ID.7. It includes slide show with NFL stats, 2 page stats calculation chart, data analysis quiz and all necessary answer keys.A fun way to get students into doing math.
Subjects:
Grades:
6th - 10th
Types:
CCSS:
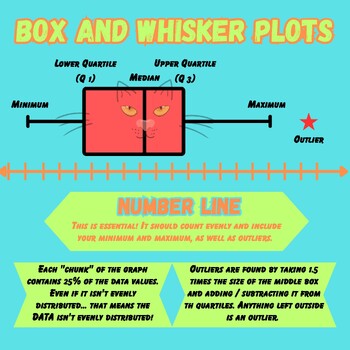
Box Plot Poster
Box plot poster showing where each number of the 5 number summary goes on a number line and describes how to find outliers using 1.5 IQR rule
Subjects:
Grades:
Not Grade Specific
Types:
CCSS:
Showing 1-24 of 27 results


