27 results
8th grade statistics homework for Easel Activities
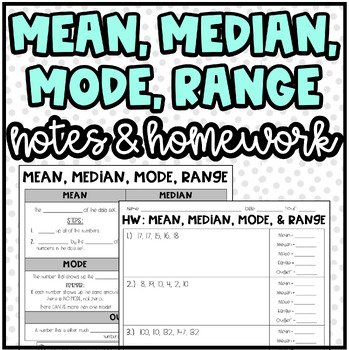
Mean, Median, Mode, Range, and Outlier | Notes and Homework or Practice
Notes & Homework: Mean, Median, Mode, Range, and Outlier:I used these notes, practice, and homework with my students. I used this lesson to serve as a "quick lesson" for the students. It covers how to find the mean, median, mode, range, and outlier.Product Includes:Notes Page with 2 examplesNotes Page Answer KeyHomework (10 organized problems with workspace provided)Homework Answer KeyThank You! ❤️I really appreciate your interest in my product! I love to create new things for my students! A
Subjects:
Grades:
5th - 8th
Two Way Tables Worksheet
Attention Math Teachers! Download this two-sided worksheet on completing two-way tables and analyzing bivariate data today! This worksheet is perfect for Pre-Algebra and Algebra 1 students as a classwork or homework activity.By completing this worksheet, students will check their understanding of how patterns in bivariate data can be seen by displaying frequencies and relative frequencies in a two-way table. They will also learn how to construct and interpret two-way tables, summarizing and inte
Subjects:
Grades:
8th - 9th
Types:
CCSS:
Also included in: Scatterplots Two Way Tables and Residual Plots Worksheets Bundle
Two Way Relative Frequency Tables Worksheet
Are you a math teacher looking for engaging classwork or homework activities to help your students with relative frequency tables? Look no further! Our worksheet on completing two-way tables and creating relative frequency tables is perfect for your needs. Great for Pre-Algebra and Algebra 1 students. With real-world situations and comprehension questions based on relative frequency tables, students will learn to summarize and interpret data collected from the same subjects. They'll construct an
Subjects:
Grades:
8th - 9th
Types:
CCSS:
Also included in: Scatterplots Two Way Tables and Residual Plots Worksheets Bundle
Box and Whisker Plots Worksheet
Hello Math Teachers! Are you looking for a fun and engaging way to teach your students about Box and Whisker Plots? Our baseball-themed worksheet is perfect for middle school and algebra classes, as well as any statistics unit.This comprehensive worksheet includes both single and double box plots, and is designed to help students progress from interpreting box plots with quartiles, interquartile range, range, and median to constructing their own box plots. The two-sided worksheet comes with an e
Subjects:
Grades:
7th - 8th
Types:
CCSS:
Also included in: Data and Statistics Worksheets Bundle
Relative Frequency Two Way Tables by Total Row or Column Worksheet
Attention Math Teachers! Enhance your students' understanding of relative frequency tables with our Two-Way Tables Worksheet. This two-sided worksheet is designed to help students create accurate relative frequency tables from basic information given in the form of a two-way table.The worksheet focuses on completing tables when using the totals by either the row or the column equal to 1.00. By practicing this skill, students will strengthen their ability to analyze data and draw conclusions.With
Subjects:
Grades:
8th - 9th
Types:
CCSS:
Also included in: Scatterplots Two Way Tables and Residual Plots Worksheets Bundle
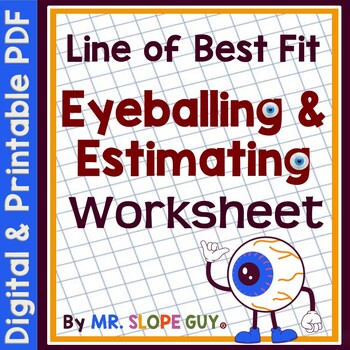
Line of Best Fit Practice Worksheet
Hello Math Teachers! Are you looking for a fun and engaging way for your students to practice their scatterplot skills? Check out this worksheet that focuses on eyeballing the line of best fit and estimating the correct equation that corresponds with it.With this two-sided worksheet, students will have the opportunity to practice using scatterplots and make the connection to the fit of a linear function. The scaffolding includes matching equations to the line of best fit (regression line), which
Subjects:
Grades:
8th
Types:
CCSS:
Also included in: Scatterplots Two Way Tables and Residual Plots Worksheets Bundle
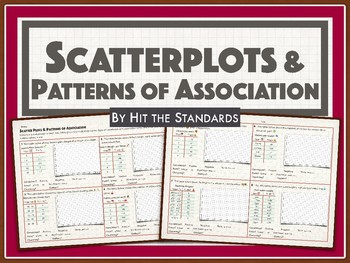
Scatterplots & Patterns of Association
Students must construct and interpret scatter plots from 8 different data tables and investigate patterns of association such as clustering, outliers, positive or negative correlation, linear or nonlinear association. Data tables are based on real world problems, students must plot the data points to construct the scatter plots. Common Core 8SP.1 & 8SP.2TEKS 8.11A Save $$$ and time by downloading the complete 8th Grade Math Unit10 Making Connections (End of Year Activities) (STAAR review) 4
Subjects:
Grades:
6th - 9th
Types:
CCSS:
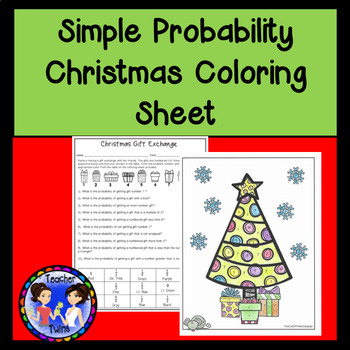
Probability of Simple Events Christmas Math Coloring Sheet
Do your students love to color? Try this Probability of Simple Events Christmas Math Coloring Sheet! This Probability Coloring Sheet contains 10 finding simple events problems. Using this Christmas coloring sheet is a great way to keep students working during the holiday season! This coloring sheet is perfect for reviewing how to find the probability of simple events. Easy setup and clear directions for students make this Probability of Simple Events Christmas Math Coloring Sheet perfect for da
Subjects:
Grades:
7th - 9th
Types:
Also included in: Middle School Math Christmas Bundle 2
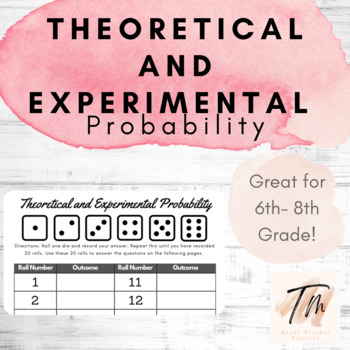
Theoretical and Experimental Probability Activity with Dice
This is a great hands on activity to have students compare theoretical and experimental probability! You could use a real die or find a dice roller online.
Subjects:
Grades:
6th - 8th
Types:
Probability of Independent & Dependent Events Word Problems (Distance Learning)
Don't we all need more word problems to use with our students? Here you go!Your students will need to think carefully to solve this set of 14 word problems involving independent and dependent events. Here are some related activities:- Independent & Dependent Probability Color by Number- Independent & Dependent Probability PuzzleCCSS.MATH.CONTENT.HSS.CP.A
Subjects:
Grades:
7th - 10th
Types:
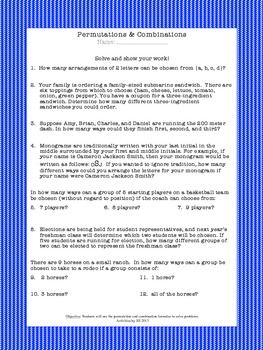
Permutations & Combinations Worksheet (Distance Learning)
Students will decide whether problems represent permutations or combinations, then use the permutation or combination formula to solve each problem. This worksheet provides routine practice.CCSS S-CPPermutations & Combinations Worksheet by Activities by Jill is licensed under a Creative Commons Attribution-NonCommercial-NoDerivatives 4.0 International License.
Subjects:
Grades:
8th - 11th
Types:
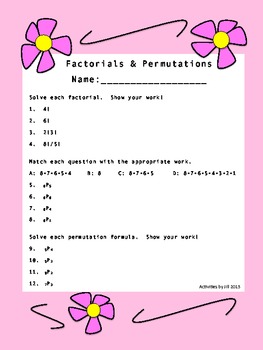
Factorials and Permutations Worksheet (Distance Learning)
Focus of Lesson: Calculate factorials and use the permutation formula. Teachers always need some routine practice for students. This twelve question worksheet will provide that or it can be used as a math center.CCSS S-CPFactorials and Permutations Worksheet by Activities by Jill is licensed under a Creative Commons Attribution-NonCommercial-NoDerivatives 4.0 International License.
Subjects:
Grades:
7th - 10th
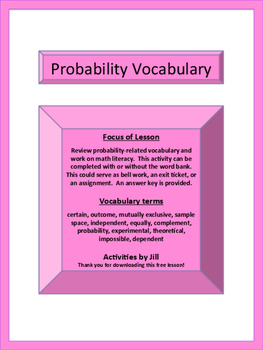
Probability Terms Worksheet with Word Bank (Distance Learning)
Focus of LessonReview probability-related vocabulary and work on math literacy. This activity can be completed with or without the word bank. This could serve as bell work, an exit ticket, a math center, or an assignment.Vocabulary termscertain, outcome, mutually exclusive, sample space, independent, equally, complement, probability, experimental, theoretical, impossible, dependentUse this note-taking product to introduce the vocabulary terms!Probability Vocabulary NotesCCSS 7.SPProbability Te
Subjects:
Grades:
6th - 9th
Types:
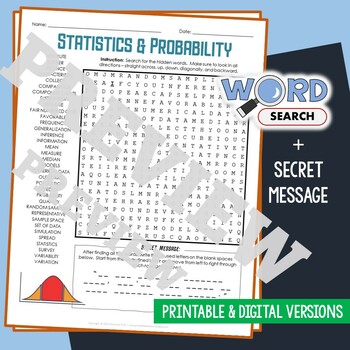
Statistics & Probability Word Search Puzzle Math Activity Terms Worksheet
Keep your students occupied with this statistics and probability word search puzzle. This is a nice puzzle to help improve their knowledge and vocabulary.There's also a secret message that your kids can uncover after completing the word search. Starting from the bold, underlined letter and moving from left to right through each row, going down, they must fill in the blanks to reveal the phrase or sentence.The words are placed in various directions - horizontally across or backward, vertically u
Subjects:
Grades:
5th - 8th
Types:
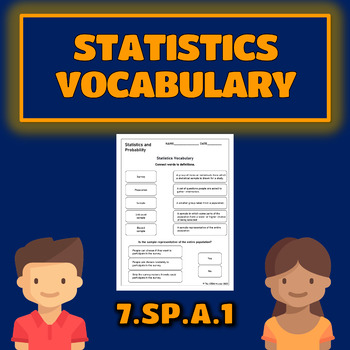
Grade 7 Math Statistics Vocabulary 7.SP.1 Worksheet
Grade 7 math statistics and probability worksheet covering statistics vocabulary survey, population, unbiased and biased sample CCSS 7.SP.A.1 7.SP.11 worksheet + answer keyCommon core assessments:✅✅✅Grade 3 Math CCSS Assessment Bundle Print & Digital✅✅✅✅✅✅Grade 4 Math CCSS Assessment Bundle Print & Digital✅✅✅✅✅✅Grade 5 Math CCSS Assessment Bundle Print & Digital✅✅✅✅✅✅Grade 6 Math CCSS Assessment Bundle Print & Digital✅✅✅Interactive slides for Google Classroom:⭐⭐⭐Grade 1 Math Inte
Subjects:
Grades:
7th - 9th
Types:
CCSS:
Also included in: 7th Grade Math Statistics and Probability 7.SP Worksheet Bundle
Statistics: z-score & standard deviation
This is a set of 12 practice questions covering the statistics standards in the Virginia Algebra 1 Standards of Learning. Problems focus on z-score and standard deviation. This is suitable to be used as a classwork or homework assignment or to review at the end of the section.
Some problems mimic the TEI (technology enhanced items) on the Virgina EOC Algebra 1 test with question formats such as "select all of the following" or "click on the graph."
Created by Amy's Algebra store on TeachersP
Subjects:
Grades:
7th - 10th
Types:
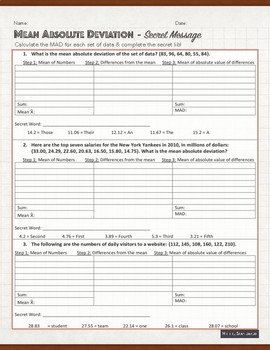
Mean Absolute Deviation with Secret Message
In this activity, students must calculate the MAD for each set of data and complete the secret message! Each set has no more than 10 data points, and each comes with a table that guides the students through the process of calculating the MAD! Just print & go!
Hits CC Standards 6.SP.B.5C, and TEKS 8.11B.
✔ Excellent for class or homework!
✔ Just print and go!
✔ Answer key included!
SAVE MONEY &TIME by downloading the complete MEAN ABSOLUTE DEVIATION Complete Unit BUNDLE Stati
Subjects:
Grades:
6th - 8th
Types:
CCSS:
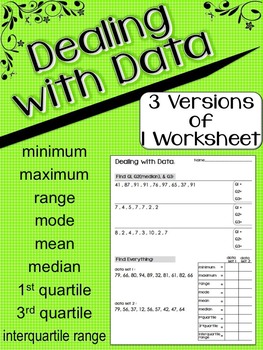
Dealing with Data - measures of dispersion and central tendency
This is a pdf file of a simple worksheet for practicing the basics - maximum, minimum, mean, median, mode, range, 1st quartile, 3rd quartile, and interquartile range.
This is an important scaffolding step because until students have a solid understanding of these concepts, they will not be ready to move on to more complex tasks with data like pulling pertinent values off of a table or creating box plots.
There are 3 versions of the same layout that can be seen in the thumbnail picture. Answer
Subjects:
Grades:
6th - 9th
Types:
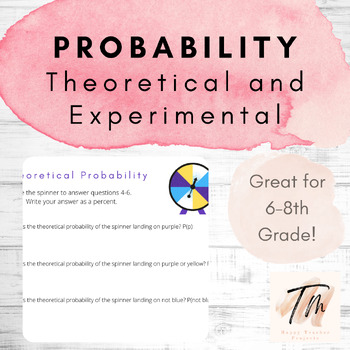
Theoretical and Experimental Probability
This worksheet includes a vocabulary start up, three theoretical questions, four experimental questions, and four questions that compare theoretical and experimental probability. This can be assigned through Google Classroom allowing them to use Kami to answer, printed and completed paper pencil, or through Easel by TPT.
Subjects:
Grades:
6th - 8th
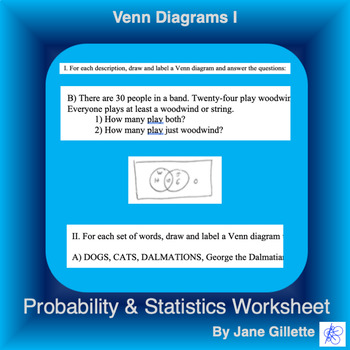
Venn Diagrams I
Practice drawing and labelling venn diagrams from verbal descriptions, and then answering questions. This is ready to print, or to assign as an online Easel Activity. The digital version is ready-to-use, but you can edit the instructions and locations of answer boxes to fit your needs.
Subjects:
Grades:
8th - 11th
Types:
CCSS:
Also included in: Bundle: Venn Diagrams
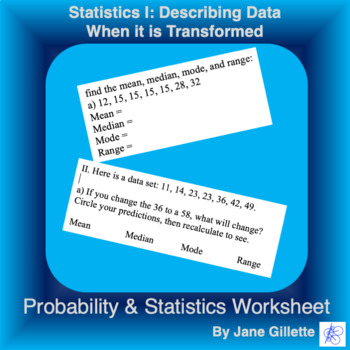
Statistics I. Describing Data When it is Transformed
Find mean, median, mode, range, and predict what happens if you add or multiply to the data, or change a data pointThis is ready to print, or to assign as an online Easel Activity. The digital version is ready-to-use, but you can edit the instructions and locations of answer boxes to fit your needs.
Subjects:
Grades:
6th - 9th
Types:
CCSS:
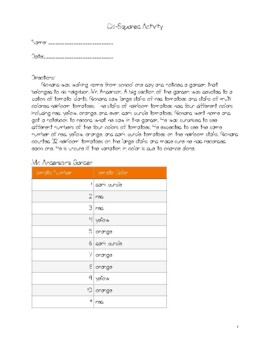
Chi-Squared Test Activity
Chi-Square Test Activity. This is a great step-by-step activity for calculating the chi-squared test by hand. This resource includes 5 pages and answer key. This is a relatively easy example to learn the basic concepts of Pearson's Chi-Square. This will help students understand a step-by-step approach. Feel free to leave a review and let me know how you like this resource!
Subjects:
Grades:
6th - 11th, Higher Education
Types:
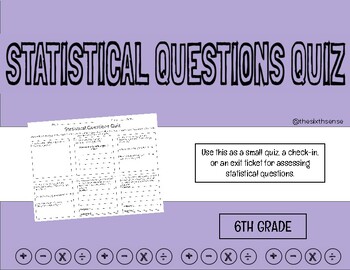
Statistical Questions Quiz
This is a simple statistical questions quiz that contains 6 questions that review various types of situations students may encounter when defining, recognizing and writing statistical questions. The quiz is worth 12 points, 2 points per question giving students more opportunity to earn points by showing work & giving accurate answers. This easy-to-grade quiz is perfect for a quick check for understanding before an assessment.
Subjects:
Grades:
4th - 9th
Types:
Also included in: 6th Grade Math Quiz Bundle
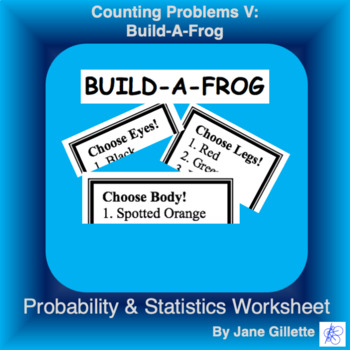
Counting Problems V: Build-A-Frog
A store gives you the chance to assemble your own toy frog by choosing from a variety of options. Practice counting principles, including n*m problems, tree diagrams, permutations, and combinations. This is ready to print, or to assign as an online Easel Activity. The digital version is ready-to-use, but you can edit the instructions and locations of answer boxes to fit your needs.
Subjects:
Grades:
8th - 11th
Types:
CCSS:
Also included in: Bundle: Permutations, Combinations, & Basic Counting Problems
Showing 1-24 of 27 results


