100 results
High school problem solving environment resources for Microsoft Excel
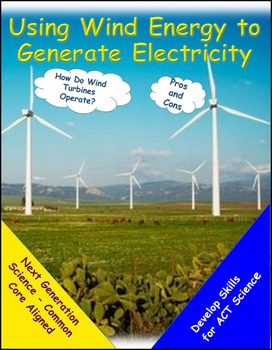
Using Wind Energy to Generate Electricity – A STEM Product
This STEM product addresses Next Generation Science - Common Core Standards with a study of wind energy, its environmental benefits, and the challenges wind energy faces to become a supplier of electricity.The product contains a 17 slide power point presentation, a student worksheet, extension projects, Teacher notes and answer keys, and an instructional MP4 video on Excel charting, and a completed Excel spreadsheet with formulas.The PowerPoint shows how windmills use wind energy to generate ele
Subjects:
Grades:
6th - 12th
NGSS:
HS-LS2-7
, HS-ETS1-2
, HS-ETS1-3
, HS-ESS3-4
, HS-PS3-3
...
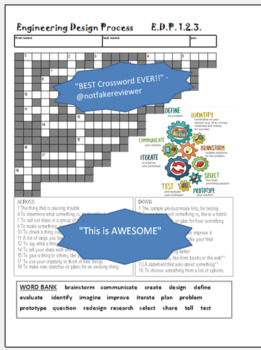
Engineering Design Process - CROSSWORD PUZZLE #2 STEM -Problem Solving -20 Clues
This 20 Clue Crossword puzzle covers the basics of the EDP steps. The answers can be found on the EDP graphic right there on the page!! Word bank & KEY included. SAMPLE CLUES:1 The thing that is causing trouble 4 To determine what something is, to describe it 7 To call out ideas in a group of people 9 To make something, especially something new. 10 To check a thing out, to see if it works right 11 A list of steps you decide on so you can reach a goalThe complete Word Bank:brainstorm
Subjects:
Grades:
7th - 9th
Types:
Also included in: STEM / Engineering Design Process BUNDLE
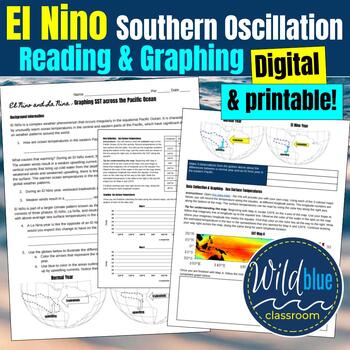
El Nino Assignment | Environmental and Marine Worksheet
This graphing assignment comes in two versions, digital and printable. The printable is 3 pages and includes reading, data collection, and graphing. Three colored maps (El Nino, La Nina, and normal conditions) are provided. If you are unable to print them in color for the class, there is a digital version you could project or provide to students. Students begin with a quick reading review of what causes El Nino (very basic). Students analyze colored maps of El NIno, La Nina, and normal condition
Subjects:
Grades:
9th - 12th
Types:
Also included in: AICE Marine Science AS Level Growing Bundle
Raccoon Game: Population Growth and Limiting Factors
This resource is a great way to explore population growth and limiting factors while also getting students up and moving. This resources includes: 1. Class instructions for the activity 2. Google Form Exit Ticket 3. Modified Google From Exit Ticket 4. Spreadsheet to help with calculations for students needing math accommodations 5. Absent student activity All you need from your classroom for the activity is.. 1. Small pieces of paper of different colors (see resource) 2. Blindfolds of some kind3
Subjects:
Grades:
7th - 10th
Types:
NGSS:
HS-LS2-3
, HS-LS4-4
, HS-LS2-2
, HS-LS4-5
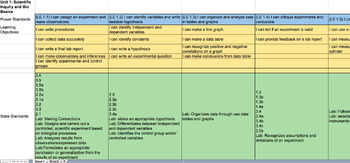
Living Environment Learning Targets - Standards Based Grading - NYS
New to Standards Based Grading? Designing Learning Targets? Live in NYS?
This is set of Learning Targets aligned to NYS Living Environment Standards, but would apply to any Biology class. The targets are categorized into power targets (the ones you grade) and sub targets (more specific targets clumped together to make power targets). All targets are written in student friendly language
Standards Based Grading may mean a lot of extra grading and analysis- so you don't want to wade through dozen
Subjects:
Grades:
8th - 12th
Types:
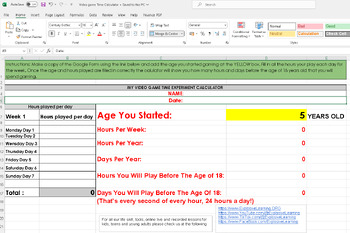
Screen Time Calculator or Video Game Time Calculator Excel sheet
Discover the power of time management with our "Video Game Time Experiment Calculator"! This interactive Excel tool is perfect for educators and parents looking to provide a practical lesson on screen time awareness. With a user-friendly interface, the calculator allows users to input the age they began playing video games and track the hours spent gaming each day. By projecting these figures up to the age of 18, it offers an eye-opening forecast on the total time dedicated to gaming, emphasizin
Subjects:
Grades:
4th - 12th, Higher Education, Adult Education, Staff
Types:
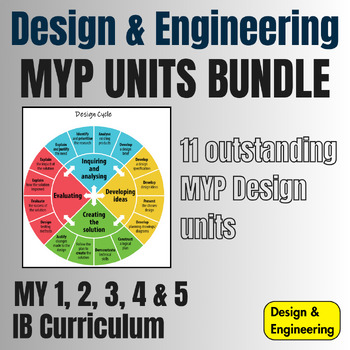
IB MYP Design Units Full Bundle
Full MYP Units Bundle which can cover the entire MYP 1 - 5 Design, representing a significant saving over buying units individually.In these outstanding, creative units, students are tasked with designing and making solutions in line with specific client-led briefs. With practical, written, and theory work closely related to the new MYP Design Specification and four assessment criteria.These units/projects have been designed for a term (12-14 weeks) or half-term (6-8 weeks) though each can be ex
Subjects:
Grades:
8th - 11th
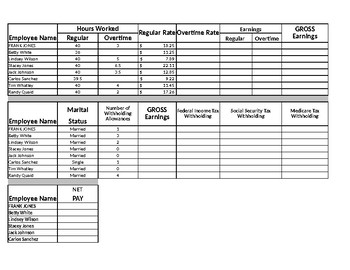
PAYROLL TAXES
Lesson will show students how to calculate:
1. Overtime Pay Rate
2. Regular and Overtime Earnings
3. Gross Earnings
4. Social Security Tax
5. Medicare Tax
6. Federal Income Tax Withholding
7. Net Pay
Also Includes answer KEY for all eight problems.
PAYROLL TAXES by ANGELO OCHOA is licensed under a Creative Commons Attribution-NonCommercial-NoDerivatives 4.0 International License.
Grades:
8th - 12th
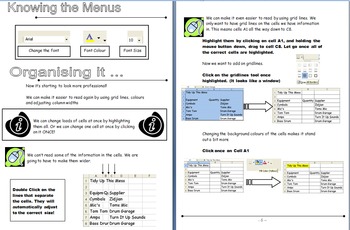
Spreadsheets Microsoft Excel Full Course
This file contains both the pupil workbook and the electronic files to accompany the task.This is aimed at pupils aged 11-15 This resource is used successfully at schools across my learning cluster.The booklet is instructional and tasks are progressive to continuously improve pupil skills and knowledge. Each task has a simple introductory task with the aim that pupils progress onto more difficult "boss tasks"I have themed this into a Music Management and pupils work for a company which manage th
Grades:
8th - 10th
Types:
Also included in: Ultimate Computer Science BUNDLE
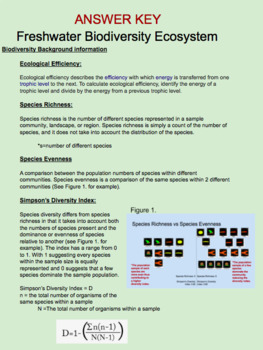
Digital biodiversity Simpson Index virtual interactive lab sheets answer key
*Editable resource*Link provided to easily copy to Google DriveObviously field study is preferred as the most effective form of research although lack of travel funds and time may not allow field study in every area of study. Use this online virtual interactive lab to study the biodiversity of macro-invertebrates of a freshwater community. Students will use the online virtual freshwater stream linked here to collect, compare, and analyze the data acquired from the virtual non-polluted, moderatel
Subjects:
Grades:
9th - 12th, Higher Education
Types:
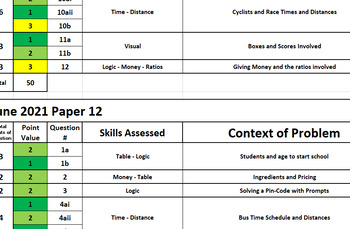
AICE Thinking Skills - Curriculum and Exam Breakdowns
(This product had originally been mistakenly uploaded incorrectly and then fixed but the negative review has never been taken down)This product includes a day-by-day breakdown of an entire First Semester, which covers all skills involved for AS level except the writing application needed in questions #2 and #5 on Paper 2. It includes all AS level Problem Solving Skills for Paper 1, as well as the AS level skills needed for questions #1, #3 and #4 (RAVEN, Main Conclusion, Intermediate Conclusion,
Grades:
8th - 12th, Higher Education
Types:
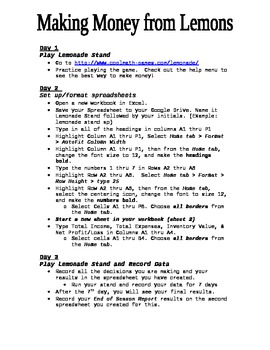
Making Money from Lemons--Microsoft Excel 2010 Project
This is an updated version of a previously posted project. This version is updated to reflect the Microsoft Office 2010 format. Students play a fun game that requires them to figure out how to make the most profit from their own "Lemonade Stand". Students will learn to create a spreadsheet that keeps track sales profit and loss. They will also create a graph that shows a sales report at the end of their "season".
Grades:
7th - 12th, Adult Education
Types:

Planning a Mutual Fund: Personal Finance Lesson Plan
This is a pretty engaging, hands-on way for students to learn about how a mutual fund (or ETF) works. It takes at least one full day, and you can turn it into something that you revisit several times during the semester. It's intended to be a partner project, but students could work alone if you wish.Students will work in partners to create a “mutual fund”, by picking stocks for their fund that share a common focus. Students pick stocks and adjust the number of shares to achieve a $1000.00 ass
Grades:
9th - 12th
Types:
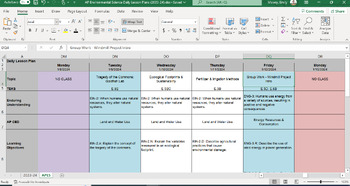
AP Environmental Science Daily Lesson Plans (2023-24)
Editable Excel file with day-by-day instruction outline based on the AP Environmental Science CED published by College Board. Includes CED aligned lesson objectives and essential knowledge statements for each day of instruction! Automatically linked from APES tab to 2023-24 tab.
Subjects:
Grades:
11th - 12th, Higher Education
Types:
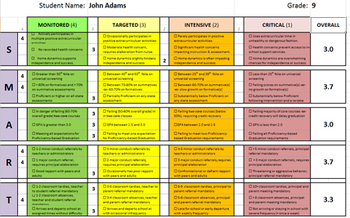
RTI: SMART Student Expectations Rubric
A dynamic rubric in Excel format that allows support teams to screen the needs of students based on a set of five criteria:
* Social/Emotional
* Measured Outcomes
* Academics
* Respect/Responsibility
* Timeliness
The results are then graphed on a spiderweb graph to show the targets for student intervention. The visual allows users to better understand the interaction of those expectations on the student's performance.
The rubric can support positive behavioral supports, Response to Intervention
Grades:
6th - 12th
Microsoft Excel Functions Workbook, Volume 2 (BUSINESS MATH)
NOTE: Check out Microsoft Excel Functions Workbook, Volume 1!This is an Excel 97-2003 workbook collection of 15 project-based, problem solving spreadsheet exercises (with complete keys - SEE PREVIEW) that help students learn to use the following powerful Microsoft Excel functions:SUMAVERAGEIFCOUNTIFCOUNTBLANKEach exercise generally takes between 1 and 2 full class periods to complete. I take 10-15 minutes to explain the problem, the deliverable, and the tools, and then let the students work inde
Grades:
8th - 12th, Higher Education, Adult Education, Staff
Types:
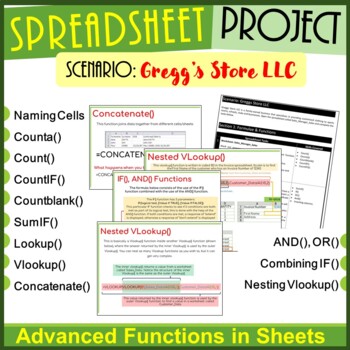
Spreadsheet Skills Project for Google Sheets ¦ Advanced Spreadsheet Functions
This Advanced Spreadsheet Skills Project for Google Sheets teaches the below advanced functions which can be used to manipulate and analyze data held in spreadsheets. Students and teachers are expected to look and read through the slides in the presentation provided and then complete the advanced level project (which is based on a scenario called Gregg's Store LLC).Not only are students expected to use their spreadsheet skills to complete this project, but they must use their skills to read thro
Grades:
8th - 12th
Types:
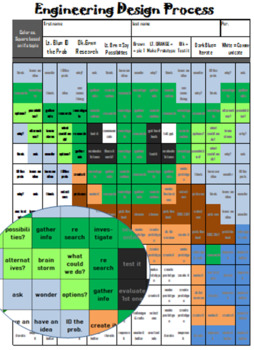
Engineering Design Process - EDP - BABY YODA - STEM -
This exciting new resource will help your students realize that there is no "ONE, PERFECT, OFFICIAL" way to describe each step in the EDP. For example - "Iterate" = "Improve it" = "Make it Better" = "Redesign & Redo".... Students color each block based on what step it is. (All "Iterate" get colored dark Blue).Students will be super excited as they near completion and can start to make out a parody of BABY YODA - one of the hottest characters of 2021. BUT WAIT - THERE'S MORE: Because I used
Grades:
6th - 12th
Types:
Also included in: STEM / Engineering Design Process BUNDLE
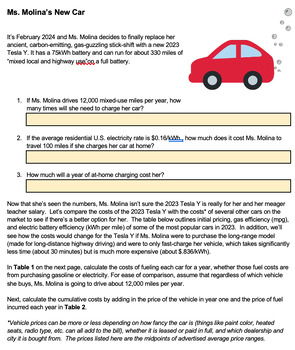
Ms. Molina's New Car AP Environmental Science Fuel Efficiency Calculation w/ KEY
In this activity students are asked to compare the costs of several of today's most popular vehicles that are gas-fueled, hybrid and electric. Students will calculate and compare the cost of purchasing the vehicle and annual fuel costs (whether for gallons of gas or cost of electricity) based on up-to-date pricing information and national averages (as of February 2024). Students can work through the calculations independently or in teams. They will then answer analysis questions to weigh the
Subjects:
Grades:
11th - 12th, Higher Education
Types:
CCSS:
NGSS:
HS-ESS3-1
, HS-ESS3-4

tragedy of the commons fishing game simulation
This simulation is a game for up to 30 players who pretend to be the decision makers for their governments. It teaches co-operation, competition and the nature of political manoeuvering. Students learn about the nature of the Tragedy of the Commons by acting it out, and can understand its pitfalls and possible solutions. It includes suggesting material for teachers as well as all the resources and instructions required for this game.
Grades:
11th, Higher Education, Adult Education
Types:
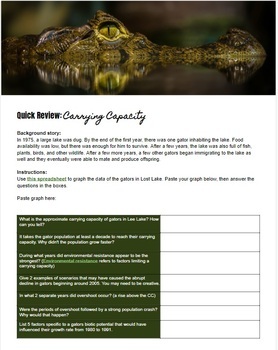
Carrying Capacity of Alligators | Graphing and Analyzing Data | Ecology
BIOTIC POTENTIAL CARRYING CAPACITY ENVIRONMENTAL RESISTANCE This is a Google Doc assignment with a link to a Google Sheets data sheet that the students will use to generate a graph. They then copy the graph into their Google Doc and then answer the questions about the carrying capacity, population dynamics, and biotic potential.
Subjects:
Grades:
9th - 12th, Higher Education
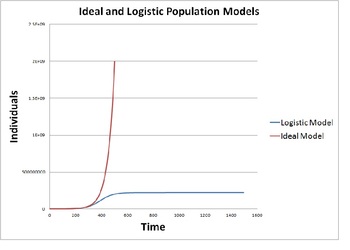
Modeling Population Growth (Ideal vs. Logistic Model)
This activity provides instructions to construct a mathematical model on a blank spreadsheet that simulates population growth using an ideal model and a logistic model. The activity provides background discussion and then gives instructions on how to program a spreadsheet to produce and display the ideal and logistic population models. Their results are studied for various cases including human population, rabbits, polar bears, bacterial and yeast colonies.
This quantitative population model
Subjects:
Grades:
9th - 12th, Staff
Types:
Microsoft Excel Functions Workbook, Volume 1
NOTE: Check out Microsoft Excel Functions Workbook, Volume 2 (BUSINESS MATH)This is an Excel 97-2003 workbook collection of 9 project-based, problem solving spreadsheet exercises (with complete keys - SEE PREVIEW) that help students learn to use the following powerful Microsoft Excel functions:IFCEILINGCHOOSECONCATENATECOUNTBLANKRANKSUMEach exercise generally takes between 1 and 2 full class periods to complete. I take 10-15 minutes to explain the problem, the deliverable, and the tools, and the
Grades:
8th - 12th, Higher Education, Adult Education, Staff
Types:
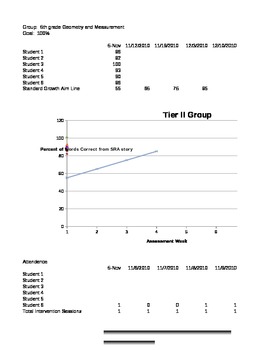
RTI small group graphing document to visualize student progression
This is a excel document you can use at the individual level for one student, or to track the entire school's RTI process. All you need to do is modify the headings to fit your school/class and the visual graph will automatically adjust to show student performance. You can type in what you want the baseline to be for student expected progression, and the graph will show how your student/s are progressing in relation to the mean. It can be applied to any content area as well as academic perfor
Grades:
PreK - 12th, Higher Education, Adult Education, Staff
Types:
Showing 1-24 of 100 results

