
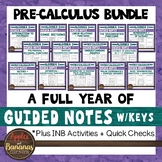
Understanding Graphs - Guided Notes, Presentation, and INB Activities


- Zip
What educators are saying
Also included in
 ********* If you have purchased our Algebra 2 Bundle you already have a lot of the material contained in this packet. We have a separate small bundle of the Pre-Calculus items that are not included in the Algebra 2 Bundle so that you can purchase the additional notes for Pre-Calc that are not includPrice $85.88Original Price $107.35Save $21.47
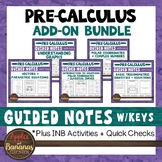 This Pre-Calculus add-on bundle contains guided/scaffolded notes and interactive notebook activities for 5 units of study, perfect for Pre-Calc students. **This product is intended as a supplement to our Algebra 2 bundle for buyers who have already purchased that product. If you would like a fullPrice $29.40Original Price $36.75Save $7.35
Description
This flexible resource on Understanding Graphs allows students to either build interactive math notebooks with guided notes (keys included) and foldable activities OR use the included presentation handouts (keys included) with the PowerPoint presentation for focused instruction. Quick checks for understanding (keys included) help to determine how well your students understand the material as you go. Choose what works best for your class and modify to make the content fit your needs. Notes are designed to clearly present the topics and reach all types of learners.
The zip file includes BOTH editable, plain-font resources and ready-to-print, non-editable PDFs. Suggested use guides are included.
Interactive Math Notebook FORMAT – Includes 3 parts: guided notes, foldable activities, and quick checks for understanding. Piece the components together and students can create their own “math textbook” in a math journal.
Presentation Sheets FORMAT – Include 2 parts: guided notes and quick checks for understanding. They are organized in the same order as the included PowerPoint and are designed to print and present. The quick checks can be cut off the bottom of the note sheets and turned in as an assessment tool.
Presentation – Plain-font, no frills, PowerPoint presentation that you can use to present content to students. Slides have blank, student note templates followed by filled in teacher keys. Modify the editable presentation to best fit your needs.
This product covers the following topics:
- Point Symmetry/Symmetry with Respect to the Origin/Example/Non-Example
- Line Symmetry (x-axis, y-axis, y=x, and y=-x)
- Parent Graph (Cut and Paste)
- Changes to Parent Functions
- Parent Function (Match)
- Are the Ordered Pairs Solutions to the Inequality?
- Steps for Graphing Non-Linear Inequalities
- Solving Absolute Value Inequalities
- Inverse Relations/Functions
- Continuous vs. Discontinuous Functions
- Discontinuous Functions (Infinite, Jump, Point, and Everywhere)
- How do you test for continuity?
- Using the Continuity Test
- Continuity on an Interval
- End Behavior of Polynomial Functions
- When is a function monotonic on an interval?
- Increasing, Decreasing, and Constant Functions
- Examining the Intervals of a Given Function
- Critical Points (Cut and Paste)
- Extrema (Cut and Paste)
- Defining Key Terms: Asymptotes
- Find the Vertical and Horizontal Asymptotes for a Graph
- Using Parent Graphs to Graph New Functions
- Horizontal vs. Slant Asymptote
- Find the Slant Asymptote and Vertical Asymptote for a Graph
- Rational Functions with a Common Factor in the Numerator and Denominator
Related Products:
**Full-year Curriculum Packs**
Algebra 1, Geometry, Algebra 2 Curriculum Pack MEGA BUNDLE
Algebra 1 Curriculum Pack BUNDLE
Geometry Curriculum Pack BUNDLE
Algebra 2 Curriculum Pack BUNDLE
Scaffolded Notes/Interactive Notebook Bundles
Pre-Calculus Add on for Algebra 2 INB Bundle
High School Math Interactive Notebook Bundle (Algebra 1, Geometry, Algebra 2)
Student Practice Pages Bundles
Algebra 1 Student Practice Pages Bundle
Geometry Student Practice Pages Bundle
Algebra 2 Student Practice Pages Bundle
High School Math Student Practice Pages Bundle (Algebra 1, Geometry, Algebra 2)
Assessment Bundles
High School Math Assessment Bundle (Algebra 1, Geometry, Algebra 2)
**If you like what you see, please click on the "Follow Me" star to learn about new products, sales, and more!
