2 results
11th grade statistics resources for Microsoft Publisher

AP Statistics Describing Distributions Graphic Organizers (SOCS and FUDS)
This download contains two graphic organizers to help students describe distributions. The first covers SOCS (or SOCV), which can be used to describe the distribution of one variable. Students can use the graphic organizer to summarize the main ideas behind Shape, Outliers, Center, and Spread (or Variability). The second covers FUDS (or DUFS, etc.) that can be used to describe the relationship between two variables. Students use the graphic organizer to summarize the main ideas behind Strength,
Subjects:
Grades:
9th - 12th
Types:
CCSS:

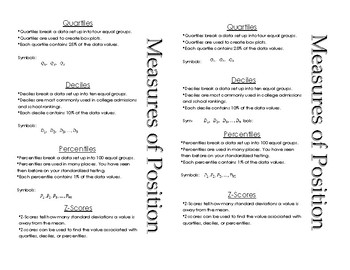
Measure of Position
This is a basic outline of quartiles, deciles, percentiles, and z-scores. I use this when I introduce measures of position to my Probability and Statistics classes. We glue it into our Interactive Notebook and include a sample problem to go with each one.
Subjects:
Grades:
11th - 12th
Showing 1-2 of 2 results


