AP Statistics Describing Distributions Graphic Organizers (SOCS and FUDS)
Samantha Timlin
32 Followers
Grade Levels
9th - 12th
Subjects
Resource Type
Standards
CCSSHSS-ID.A.1
CCSSHSS-ID.A.2
CCSSHSS-ID.A.3
Formats Included
- Publisher files
Pages
4 pages
Samantha Timlin
32 Followers
Description
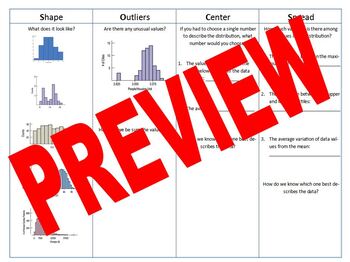
This download contains two graphic organizers to help students describe distributions.
The first covers SOCS (or SOCV), which can be used to describe the distribution of one variable. Students can use the graphic organizer to summarize the main ideas behind Shape, Outliers, Center, and Spread (or Variability).
The second covers FUDS (or DUFS, etc.) that can be used to describe the relationship between two variables. Students use the graphic organizer to summarize the main ideas behind Strength, Form, Direction, and Unusual Features.
Answer Keys are included for both graphic organizers.
Total Pages
4 pages
Answer Key
Included
Teaching Duration
30 minutes
Report this resource to TPT
Reported resources will be reviewed by our team. Report this resource to let us know if this resource violates TPT’s content guidelines.
Standards
to see state-specific standards (only available in the US).
CCSSHSS-ID.A.1
Represent data with plots on the real number line (dot plots, histograms, and box plots).
CCSSHSS-ID.A.2
Use statistics appropriate to the shape of the data distribution to compare center (median, mean) and spread (interquartile range, standard deviation) of two or more different data sets.
CCSSHSS-ID.A.3
Interpret differences in shape, center, and spread in the context of the data sets, accounting for possible effects of extreme data points (outliers).


