43 results
11th grade Common Core 6.SP.B.5a resources
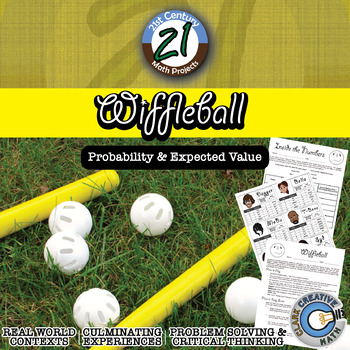
Wiffleball -- Theoretical & Experimental Probability - 21st Century Math Project
Theoretical and Experimental Probability gets a 21st Century Math Project facelift in this interactive game. Tired of flipping coins and spinning spinners? Students play the role of team managers and with only player statistics they must build a team capable of winning the championship. Students will plays a series of Wiffleball games where they will keep track of statistics using a baseball/softball inspired scorebook and after the game crunch the number to see if their players performed up to
Subjects:
Grades:
6th - 12th
Types:
Also included in: Probability & Expected Value Unit Bundle - Distance Learning Compatible
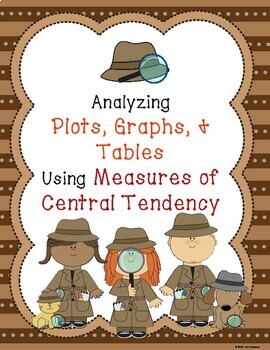
Analyzing Plots, Graphs, and Tables using Measures of Central Tendency
This product provides students the opportunity to analyze data presented in different ways. By making calculations and analyzing data, students make conjectures and justify them using mathematical reasoning and evidence!What is included?This product contains 8 student work pages. Each work page contains a set of data displayed graphically with accompanying questions. The data displays included are 2 dot plots, 2 bar graphs, 2 frequency tables, and 2 stem-and-leaf plots. Students are required
Subjects:
Grades:
5th - 11th
Types:
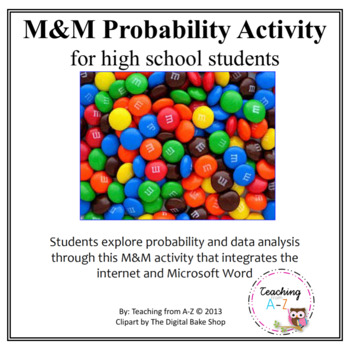
M&M Probability Project
M&M Probability Project is a great project for high school students. I did this project with my Algebra 2 class composed of 34 students, 8 of which are Limited English Proficient (ESOL) students and 2 are Exceptional Student Education (ESE) students. They loved it! Students worked collaboratively in pairs on this M&M Probability Project, used the internet for research on creating different types of graphs, and practiced creating tables using Microsoft Word. ***Project links have been upd
Subjects:
Grades:
8th - 12th
CCSS:
Middle School/Upper Elementary Scientific Method and STEM Fair Unit
This unit was designed as a way to incorporate STEM into a more traditional Science Fair model with connections to STEM careers. Students are encouraged to choose a topic that they are deeply interested in and they learn how to connect scientific thinking to concepts outside of science class. They are also introduced to future STEM careers and community resources. The unit is directly aligned to Next Generation Science Standards (NGSS) and the Common Core.
In order to help students achieve t
Subjects:
Grades:
4th - 11th
Types:
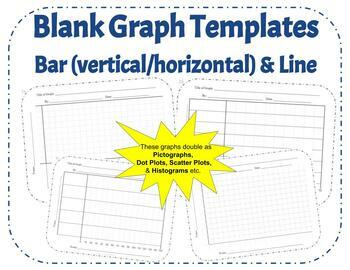
42 Blank Graph Templates: Horizontal & Vertical Bar Graph, Line Graph, Printable
Looking for an array of printable graph templates for all your future bar and line graph needs? Look no further! With 42 different templates ranging for bar graphs, to line graphs, varying in X values and Y values, this combination should be the last graph download you need to worry about for your class. These graphs can even be used as Histograms, Dot Plots, Scatter Plots, or a variety of other graphs to suit the needs of your classroom.I created this template to require all the basics of gr
Grades:
4th - 12th
Types:
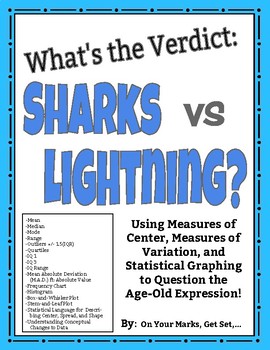
What's the Verdict: Sharks vs. Lightning? Modes of Center, Spread, and More!
Put it to the test! Use the age-old expression: "You are more likely to get struck by lightning than to be bitten by a shark!" to learn and practice Measures of Center, Measures of Spread, Measures of Shape, and Statistical Graphing including:MEANMEDIANMODERANGEOUTLIERS [Using IQR +/- 1.5(IQR)]QUARTILES [lower quartile (IQ-1) and upper quartile (IQ-3)]INTERQUARTILE RANGE (IQR)MEAN ABSOLUTE DEVIATION/ M.A.D. ft. ABSOLUTE VALUESYMMETRY/ASYMMETRY OF DISTRIBUTIONCLUSTERS AND GAPSBELL SHAPED CURVE AN
Subjects:
Grades:
5th - 12th, Higher Education, Adult Education
Types:
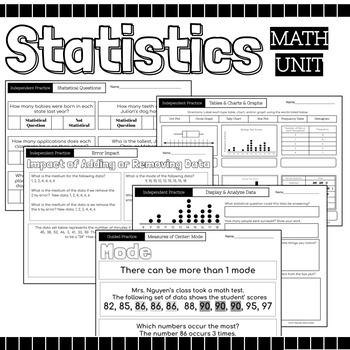
Statistics Math Packet {Data, Charts, Graphs, Mean, Median, Mode, Range, Spread}
52 Page Statics Unit Includes: Guided Instruction & Independent Practice Pages Usage Suggestions and IdeasThis resource can be utilized in numerous ways, here are some ideas:use for guided practiceassign as partner workassign as independent practicecan be used for morning workuse for reteaching in small group settinguse as review prior to assessmentuse as review in continuing to strengthen skillassign for homeworkuse as independent work during math centersTopicsRecognize Statistical Question
Subjects:
Grades:
4th - 12th
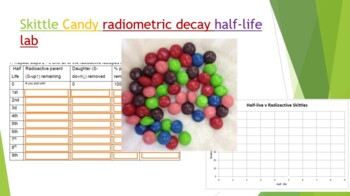
Skittle Radiometric Decay Half-life Lab
Did you know you can use Skittles candy to demonstrate absolute dating and radiometric decay! Buy a 1-4 lb bag at your local bulk warehouse store for savings. This lab is a great way to show how isotopes decay by shaking a plate full of random skittles. Students use Skittles to observe "Isotopes" decay over each half life. At the end of the lab (and only IF they have done all their work) they can enjoy their "daughter products". Skittles were used because they are durable, hypoallergenic, and th
Subjects:
Grades:
8th - 12th, Higher Education, Adult Education
Types:
NGSS:
HS-PS1-8
, HS-PS1-1
, HS-PS1-4
, HS-PS1-6
, MS-PS1-4
...
Also included in: Hands-on Science Semester Labs Bundle
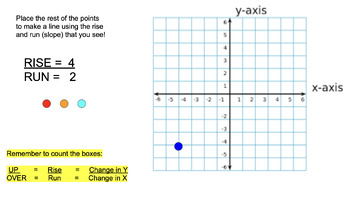
Coordinate Plane, Slope, Rise/Run, Graphing - Online No Prep Bundle
A bundle of activities which can be used as formal lessons or independent practice. Great for Google Classroom or Smart-boards! Also can be used as sub plans! Created by a Special Education Math Teacher to help students become comfortable with graphing!
Grades:
5th - 12th
NYS State Math Test Review Packet: 6th Grade
Aligned with the NYS State Math Test mathematics review sheet. Colorful, kid-friendly way to remind students to baseline at the beginning of the year or to review a full year of 6th grade skills and standards. Includes both straight computation and word problems. Can be used in gifted and talented programs as well or for enrichment for advanced learners or as skill review in HS basic skills or adult education programs in preparation for TASC or GED test.Intervention / MTSS / RTI / AIS / Special
Subjects:
Grades:
3rd - 12th, Higher Education, Adult Education, Staff
Types:
FREE EDUCATIONAL WEBSITES LIST 4 ALL GRADES K-12 AND SUBJECTS + TEACHER RESOURCE
Sometimes, you just need a list of websites for everyone. Here it is. FREE EDUCATIONAL WEBSITES Put together by Teach Me, Maria!It takes time to gather this information, figure out the appropriate grade levels, and format, maintain, and update this page. All I ask is for an honest review if this list helps you.
Subjects:
Grades:
PreK - 12th, Staff
Types:
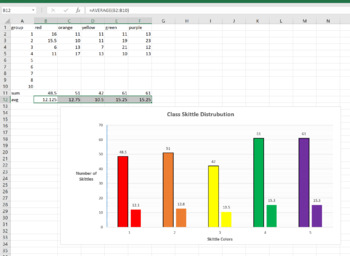
Skittle Statistics MS Excel Mini-Lab
This is a 1 class MS Excel lab for a computer or math class. You can have the students explore the distribution of different color Skittles in class. This is a great mini-lab or half-day activity when you school ends up with a weird schedule day. Tell them they can't eat till the Skittles till the end of class, or they will distort their numbers. Also make sure they don't throw them or shove them up their nose (Yes, stuck Skittles are hard to extract, ask me how I know..)The goal of this lab is
Grades:
6th - 12th, Higher Education, Adult Education
Types:
NGSS:
MS-ETS1-2
, HS-ETS1-2
, HS-ETS1-3
, MS-ETS1-4
, MS-ETS1-1
...
Also included in: Hands-on Science Semester Labs Bundle
Lluvia de Colores (Actividad para aplicar método científico)_Español
En ocasiones necesitas una actividad que no utilice muchos materiales y que no genere un ambiente formal como lo es la experiencia de laboratorio. Esta actividad fue pensada en lograr esto y que a la vez los estudiantes apliquen el método científico. Incluye: 1.Hoja de trabajo imprimible a color PDF2.Hoja de trabajo imprimible en blanco y negro PDF3.Hoja de trabajo en formato digital PPT4.Guía para el maestro PDF y PPTPuedes complementar esta actividad con los recursos del método científico di
Subjects:
Grades:
6th - 12th
Types:
Game Templates Bundle
This Bundle includes Templates to create your own games! You can use this for any subject, any grade level! This is a great investment since you can use the templates over and over again!Game Templates included are:Connect 4MonopolyScrabblePac-man Race If you ever need any help with any of the templates and creating your own games with them, please reach out to us! We are happy to help!contact@middlemathenthusiast.com
Subjects:
Grades:
PreK - 12th, Higher Education, Adult Education, Staff
Types:
NGSS:
MS-ESS3-2
, MS-ESS3-1
, MS-ESS3-5
, MS-ESS3-4
, MS-ESS3-3
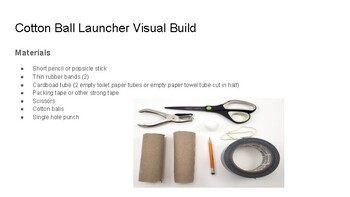
Project Based Learning Cotton Ball Launcher Visual Build Guide
10 Reasons Why You Will Want to Purchase this Hand ON Activity!1. It will keep kids entertained.2. Kids will be engaged with their activity.3. FEWER BEHAVIOR INCIDENTS4. Kids will enjoy their work activities.5. It is just plain fun.6. State Standards Align.7. Kids are actively engaged.8. Sequential Activity9. Bloom's higher-order thinking and process skills center 10. Student-led.
Subjects:
Grades:
1st - 11th, Higher Education, Adult Education, Staff
Types:
Intro to Statistics Unit Lessons
Complete lessons for everything your students need to know to get started studying stats.
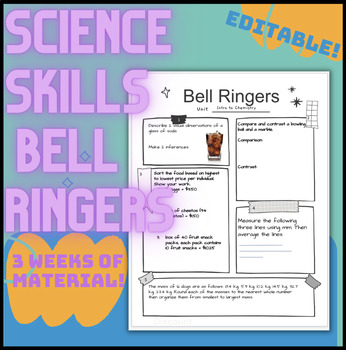
Science Skills Bell Ringers
3 weeks worth of bell ringers focused on basic science skills including determining variables, reading graphs and data tables, making observations and inferences, explaining your thinking, forming hypotheses, sorting information, averaging, measuring, compare and contrast, rounding data and creating a claim. Some questions are open ended and do not have a right/wrong answer, some do have correct answers. These bell ringers are best used with upper middle school through high school. Answer Key is
Subjects:
Grades:
7th - 12th
Types:
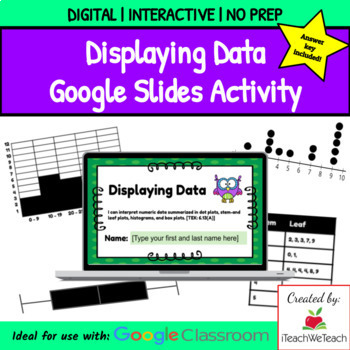
Interpreting Data Displays | Google Slides | Distance Learning | No Prep
★ DIGITAL Math Resource★ Are you looking for quality, standards aligned math resources to use with Google Classroom™? This resource is a fun and engaging way for students for review creating and interpreting data displays. It includes vocabulary and lots of practice.Possible Uses:Lesson & PracticeSummer EnrichmentHome SchoolInterventionHomeworkReteachDistance LeanringIf you haven’t already created a free Google account for yourself and your student(s) (or a Google Classroom account), you wil
Subjects:
Grades:
6th - 12th
Types:
Also included in: Statistics Bundle | Google Slides Activities | Download & Go!
Creating Graphs from Data:Meeting the Common Core
Creating a graph to represent data gives us a better picture of what the numbers are trying to tell us. Using a step-by-step approach, this activity will demonstrate for each student how to generate various types of graphs and plots to interpret given data. Terms such as range, class, frequency, interval, pie charts, histograms, and line graphs are introduced to assist the student in creating and understanding these graphs. After introducing the terms and a class discussion has taken place,
Subjects:
Grades:
4th - 12th, Higher Education, Adult Education
Types:

All of the Common Core Math Standards Checklists
This is a bundle of checklists for Math Common Core Standards for all of the grades (K-12) on an excel spreadsheet with 5 columns for data input. These standards are organized in their own sub-domains to coordinate lessons. Please see my free file for an example.
Subjects:
Grades:
K - 12th
Types:
Intro to Statistics Lesson #1 - Statistical Questions (Editable)
Lesson one to intro to statistics unit. Answering the question to what is statistics, how do we ask a statistical question, and what is the difference between numerical and statistical data. Complete with warm-up, practice, and the opportunity to complete a project to apply our learning!
Subjects:
Grades:
6th - 12th
Types:
Also included in: Intro to Statistics Unit Lessons
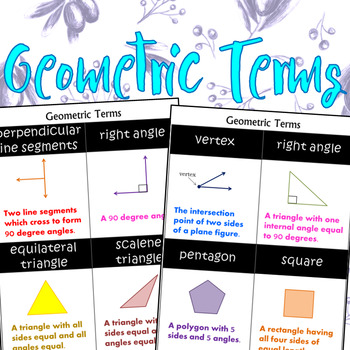
7th Grade Geometric Terms
Geometric terms flashcards, handouts.Each card includes a picture and description of each geometric term.Perfect review material before testing!Geometric terms included:•perpendicular line segments•right angle•equilateral triangle•scalene triangle•vertex•right angle•pentagon•square•intersecting line segments•acute angle•chord•radius•line segment•line•point•parallelogram•rectangle•rhombus•parallel line segments•quadrilateral•octagon•circle•trapezoid•ray•closed curve•isosceles triangle•hexagon•dia
Subjects:
Grades:
5th - 12th
Types:
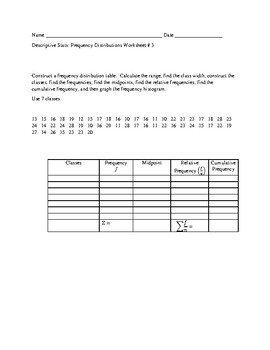
Frequency Distribution Worksheet #3 with Answer Key
This worksheet contains one problem that asks students to complete a frequency distribution table, including constructing the classes, finding the class width, calculating the midpoints, finding the relative and cumulative frequencies, and then draw a frequency histogram for the data.You may also be interested in:Frequency Distribution Worksheet #1Frequency Distribution Worksheet #1 with Answer KeyFrequency Distribution Worksheet #2Frequency Distribution Worksheet #2 with Answer Key
Subjects:
Grades:
9th - 12th, Higher Education
Types:
CCSS:
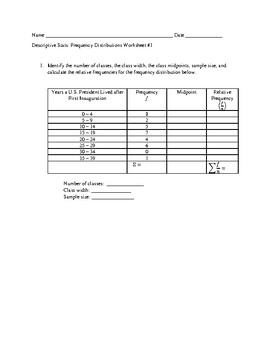
Frequency Distribution Worksheet #1 with Answer Key
This two page worksheet contains two problems that asks students to complete a frequency distribution table, including constructing the classes, finding the class width, calculating the midpoints, and finding the relative frequencies. Each page contains a chart and enough room for students to complete any work.The first problem is already started, with the classes and the frequencies listed. Students have to complete the rest of the chart.The second problem gives a data set and the first two c
Subjects:
Grades:
9th - 12th, Higher Education
Types:
CCSS:
Showing 1-24 of 43 results


