158 results
Statistics word walls for Microsoft OneDrive
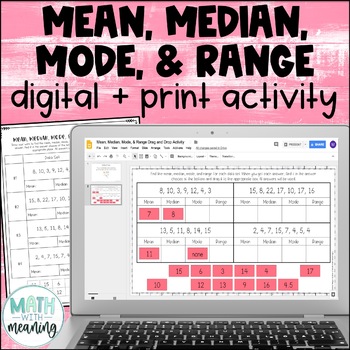
Mean, Median, Mode, & Range Digital and Print Activity for Google Drive
Looking for a fun, no-prep activity for finding mean, median, mode, and range? Students will find the mean, median, mode, and range for 4 data sets. They will then then find their answer from the answer choices at the bottom and drag it to the appropriate spot. Each data set contains 6-8 numbers. Please view the preview file to make sure that this activity is appropriate for your students.This product includes the following:A link to the digital activity on Google Slides including student direct
Subjects:
Grades:
5th - 8th
CCSS:
Also included in: Middle School Math Digital and Print Activity Bundle Volume 1
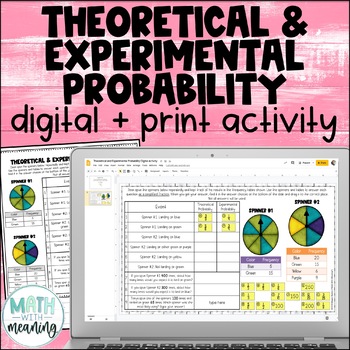
Theoretical and Experimental Probability Digital and Print Activity
Looking for an engaging, no-prep activity to practice working with theoretical and experimental probability? Students will use two sets of spinners and frequency tables to answer questions in this fun digital and print activity.This activity requires students to find the theoretical and experimental probabilities of simple events and to use theoretical probabilities to make predictions. Please view the preview file to make sure that this activity is appropriate for your students.This product inc
Subjects:
Grades:
5th - 8th
CCSS:
Also included in: Middle School Math Digital and Print Activity Bundle Volume 3
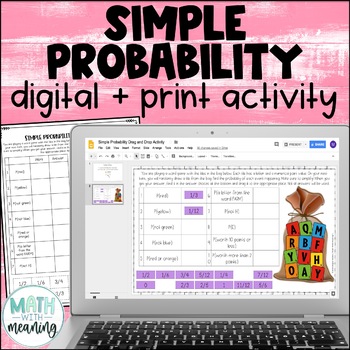
Simple Probability Digital and Print Drag and Drop Activity for Google
Looking for an engaging, no-prep activity to practice finding the probability of simple events? Students will use the included image to find the probability of 10 simple events. They will then find their answer from the answer choices at the bottom and drag it to the appropriate spot. Please view the preview file to make sure that this activity is appropriate for your students.This product includes the following:A link to the digital activity on Google Slides including student directionsA PowerP
Subjects:
Grades:
5th - 8th
CCSS:
Also included in: Middle School Math Digital and Print Activity Bundle Volume 1
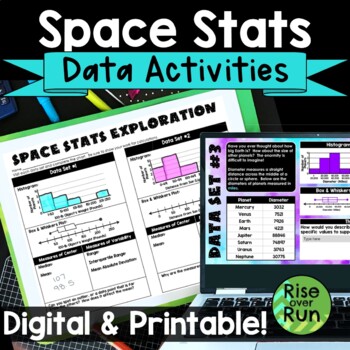
Box and Whiskers Plots and Histograms Activity with Real World Space Statistics
Use statistics for a real world application with this engaging activity about space stats! Students use real data to create histograms, box and whiskers plots, as well as calculate median, mean, range, interquartile range, and mean absolute deviation. This lesson works great for a space room transformation if you choose! Components are included in printable versions for in-person learning and Google Slides + Microsoft PowerPoint for online learning.Here’s what is included:Intro Presentation (Po
Subjects:
Grades:
6th - 9th
Types:
Also included in: Algebra 1 and 8th Grade Math Curriculum Bundle for Entire Year
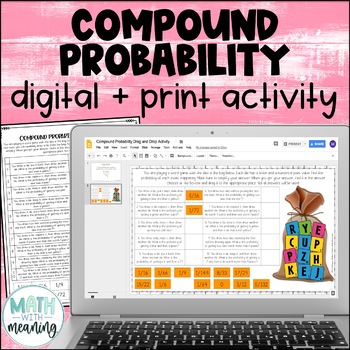
Compound Probability Digital and Print Activity for Google Drive and OneDrive
Looking for an engaging, no-prep activity to practice finding the probability of compound events? Students will use the included image to find the probability of 10 compound events, including both independent and dependent events. They will then find their answer from the answer choices at the bottom and drag it to the appropriate spot. Please view the preview file to make sure that this activity is appropriate for your students.This product includes the following:A link to the digital activity
Subjects:
Grades:
6th - 9th
CCSS:
Also included in: Middle School Math Digital and Print Activity Bundle Volume 1
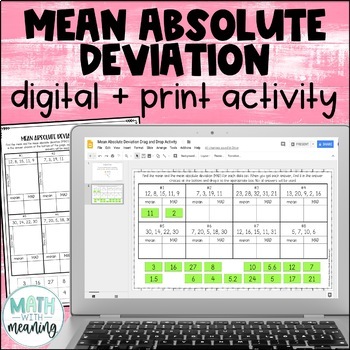
Mean Absolute Deviation MAD Digital and Print Activity for Google Drive
Looking for an engaging, no-prep activity to practice finding the MAD? Students will find the mean and mean absolute deviation for 8 data sets. They will then then find their answer from the answer choices at the bottom and drag it to the appropriate spot. Each data set contains 4-5 numbers. The mean of each data set is a whole number. Please view the preview file to make sure that these types of problems are appropriate for your students.This product includes the following:A link to the activit
Subjects:
Grades:
6th - 9th
CCSS:
Also included in: Middle School Math Digital and Print Activity Bundle Volume 2
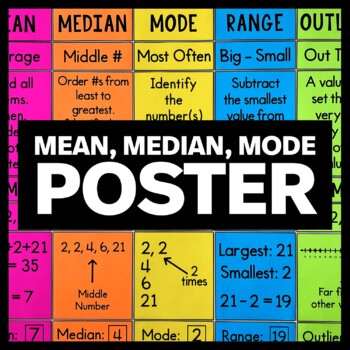
Mean, Median, Mode Poster - Measures of Central Tendency - Math Classroom Décor
Do you need a little help teaching measures of central tendency to your math class? Are you looking for a mean, median, and mode bulletin board display? This poster will look GREAT on your word wall and will help your upper elementary or middle school math class remember this important concept. Two different versions of the poster are included along with several alternate panels for mean, median, mode, and range. Extra panels for "outlier" are not included.The first version of the poster has
Subjects:
Grades:
5th - 8th
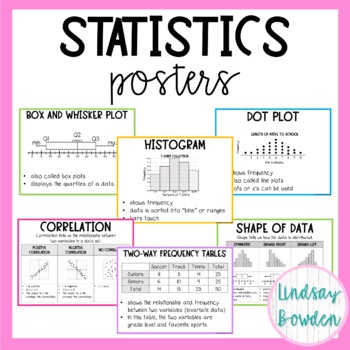
Statistics Posters (Algebra 1 Word Wall)
These statistics posters come with 18 posters on letter paper (8.5" by 11"). They are meant to be printed in color, but you can also print them in black and white.Posters include:box and whisker plots, histograms, stem and leaf, dot, plot, range, interquartile range, measures of central tendency, mean absolute deviation, shape of data, peaks in data, spread of data, scatter plots, correlation, causation vs. correlation, line of best fit, two-way frequency tables, standard deviation, normal dist
Subjects:
Grades:
8th - 10th
Also included in: Statistics Unit Bundle
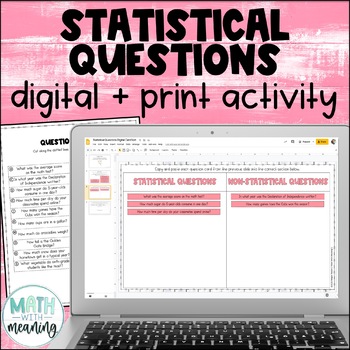
Statistical Questions Digital and Print Card Sort for Google Drive and OneDrive
Looking for an engaging, no-prep activity to practice identifying statistical and non-statistical questions? Students will read 20 questions and determine if they are statistical or non-statistical questions in this fun digital and print card sort activity. They will also choose a topic and write one one of each type of question of their own about that topic.Please view the preview file to make sure that this activity is appropriate for your students.This product includes the following:A link to
Subjects:
Grades:
5th - 8th
CCSS:
Also included in: Middle School Math Digital and Print Activity Bundle Volume 3
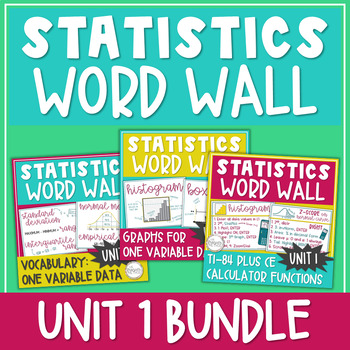
Statistics Word Wall / Statistics Posters / Math Bulletin Board Graphs & Charts
43 PAGES of Statistics Posters to add high school math classroom décor to your math bulletin board, math word wall, hallway, door, or as anchor charts with these 8.5" by 11" Statistics Word Wall Posters filled with STATISTICS GRAPHS, VOCABULARY, & TI-84 PLUS CE CALCULATOR FUNCTIONS! Definitions, formulas, graph features, and step-by-step calculator directions! Everything included in this bundle is from Unit 1: Exploring One-Variable Data in AP Statistics, and the information on each slide a
Subjects:
Grades:
10th - 12th
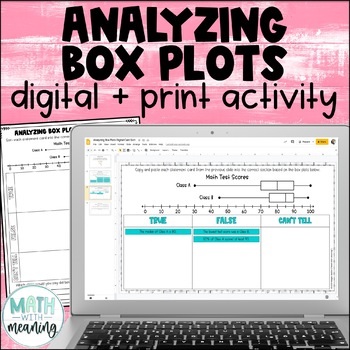
Box and Whisker Plot Digital and Print Card Sort - Reading and Analyzing
Looking for an engaging, no-prep activity to practice reading and analyzing box plots? Students will look at a double box plot and determine if statements about it are true, false, or if they can't tell from the information given in this fun digital and print activity.This activity includes statements about the minimum, maximum, median, quartile 1 (Q1), quartile 3 (Q3), interquartile range (IQR), and range of the box plots, along with statements about the percentages represented by a particular
Subjects:
Grades:
6th - 9th
Also included in: Middle School Math Digital and Print Activity Bundle Volume 3
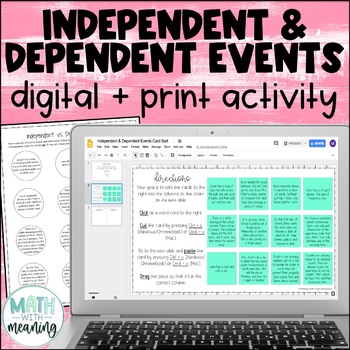
Independent and Dependent Events Digital Print Card Sort - Compound Probability
Looking for an engaging, no-prep activity to practice identifying independent and dependent events? Students will read 12 sets of compound events and determine if they are independent or dependent events. Many examples of real-world events are included. This is a great activity for students learning compound probability who struggle with differentiating between independent and dependent events. Also included is a printable graphic organizer that is perfectly sized for interactive notebooks. Plea
Subjects:
Grades:
6th - 9th
CCSS:
Also included in: Middle School Math Digital and Print Activity Bundle Volume 2
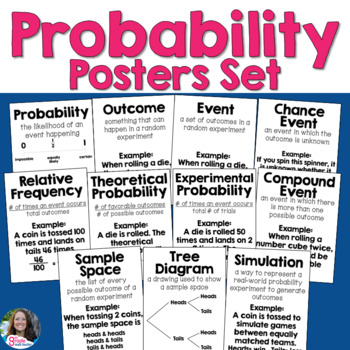
Probability Posters Set for Anchor Charts or Word Wall
This set of 11 posters serves to provide visuals and definitions for students during your probability unit! The posters are black and white and can be printed on card stock from your own printer. Hang them on your word wall for students to access the critical vocabulary. They can also be printed as large as 18" x 24" to use as math anchor charts.The following vocabulary terms are included in this set:ProbabilityOutcomeEventChance EventRelative FrequencyTheoretical ProbabilityExperimental Probabi
Subjects:
Grades:
7th
Types:
Also included in: 7th Grade Math Vocabulary Posters for Full Year Word Wall
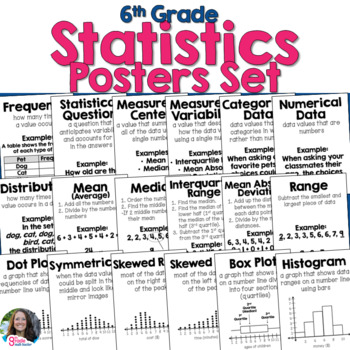
6th Grade Statistics Posters Set for Anchor Charts or Word Wall
There is so much vocabulary for 6th Grade Statistics! Students need to be able to reference the terms and see examples of all the new vocabulary they must learn. This set of 20 printable posters provides visuals and definitions of all the terms for students during your Grade 6 statistics and data unit!The posters are neat, clear, and organized. They are black and white and can be printed on card stock from your own printer. Hang them on your word wall for students to access the critical vocabula
Subjects:
Grades:
6th
Types:
Also included in: 6th and 7th Grade Statistics Posters for Word Wall BUNDLE
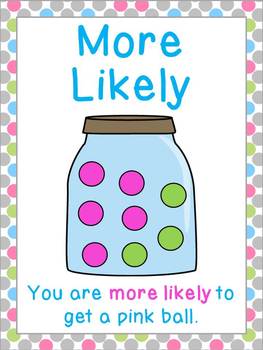
Probability Vocabulary Posters
Probability vocabulary posters: 10 cute probability posters to help students visually understand probability vocabulary terms certain, likely, unlikely, equally likely, more likely, less likely, impossible, possible, very likely, and very unlikely.
These can be used to teach probability since each poster has a comprehensible visual. They are great classroom posters to hang up for students to reference.
These are included in the super jam-packed Probability MEGA Pack which I highly recommend f
Subjects:
Grades:
K - 5th
Types:
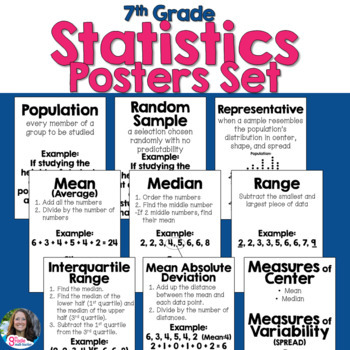
7th Grade Statistics Posters Set for Anchor Charts or Word Wall
This set of 10 posters serves to provide visuals and definitions for students during your statistics and data unit! The posters are black and white and can be printed on card stock from your own printer. Hang them on your word wall for students to access the critical vocabulary. They can also be printed as large as 18" x 24" to use as math anchor charts.The following vocabulary terms are included in this set:PopulationSampleRandom SampleRepresentativeMeanMedianRangeMeasures of Center & Measu
Subjects:
Grades:
7th
Types:
Also included in: 7th Grade Math Vocabulary Posters for Full Year Word Wall
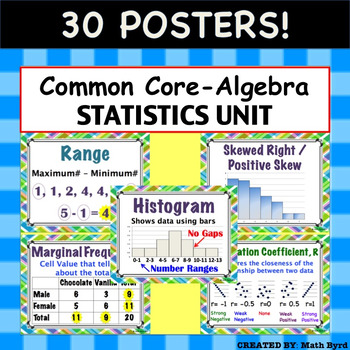
Common Core Algebra - Statistics Unit: Describing Data POSTERS
30 Posters! Each 8.5" x 11" in size. Posters are aligned with Common Core's Algebra - Statistics: Describing Data Unit. Posters Included:MeanMedianModeRangeInterquartile RangeOutlierMean Absolute DeviationMeasures of CenterMeasures of SpreadDot PlotHistogramBox PlotNormal/ Bell Shaped DistributionSkewed Right/Positive SkewSkewed Left/ Negative SkewUniform2 Way Frequency TableJoint FrequencyMarginal Frequency2 Way Relative Frequency TableConditional Relative FrequencyScatter PlotCorrelationCorrel
Subjects:
Grades:
8th - 11th
CCSS:
Also included in: Common Core Algebra 1 POSTERS - BUNDLE PRICE!
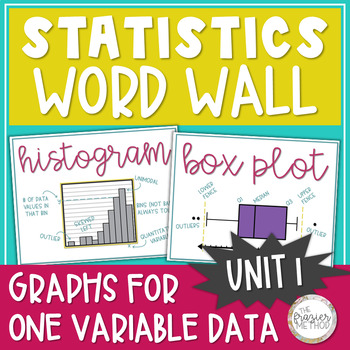
Statistics Word Wall Posters - Histogram, Box Plot, Bar Graph, Dot Plot Unit 1
Use these Statistics Posters to add high school math classroom decor to your bulletin board, hallway, math word wall, or classroom door with these great 8.5" by 11" Statistics Word Wall pages filled with statistics vocabulary, formulas, and graphs! All graphs are from Unit 1: Exploring One-Variable Data in AP Statistics, and the information on each slide aligns with AP College Board's objectives and standards for AP Statistics. ALL PAGES ARE IN COLOR & GRAYSCALE.Size: 8.5 by 11 inches[If you
Subjects:
Grades:
10th - 12th
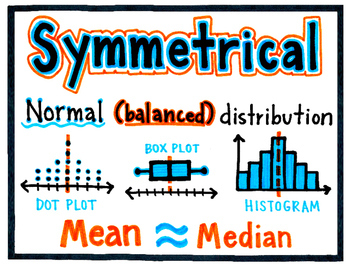
Shape of Data Distribution Mini Word Wall
This mini word wall contains four words to help students describe the shape of given data as asymmetrical, skewed left, skewed right, and symmetrical. Each page has the word, the definition, and 3 examples data distributions. Each word is handmade and colorful in order to capture your students' interest.These posters work ideally with the Math word walls listed on our website, but may be used with any other set of word walls as well.If you have any other questions or feedback to offer, please co
Subjects:
Grades:
6th - 8th
Types:
Statistics Word Wall
Included are 25 digital posters (list of words below) for a vocabulary word wall in Statistics specifically for the AP curriculum. I use this product in my classroom as part of a larger display. As we cover a topic, I post the word wall poster. Then, before the AP exam, we use the word wall as a place for review. Each of the words includes some sort of imagery that defines the word to help students remember these topics. These images will help any level of Statistics students and some can be use
Subjects:
Grades:
7th - 12th
Types:
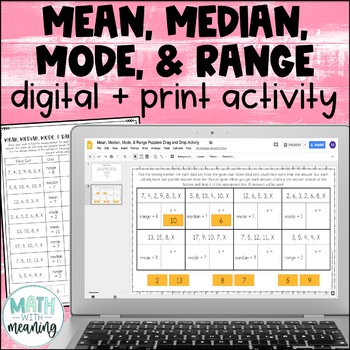
Mean, Median, Mode, & Range Missing Numbers Digital and Print Activity
Looking for a fun, no-prep activity for calculating mean, median, mode, and range? Students will find the missing number in a data set given either the mean, median, mode, or range. They will then then find their answer from the answer choices at the bottom and drag it to the appropriate spot. Each data set contains 4-7 numbers. Some data sets have more than one possible answer, but only one possible answer choice will be given. Please view the preview file to make sure that this activity is app
Subjects:
Grades:
5th - 8th
CCSS:
Also included in: Middle School Math Digital and Print Activity Bundle Volume 1
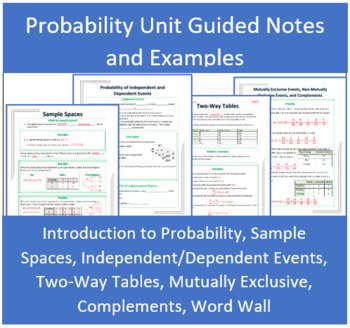
Probability Unit Guided Notes and Practice
The Probability Guided Notes and Practice bundle was made for a high school geometry level course, but could be used for a Probability/Statistics course or an honors level middle school course as well. Included in this bundle is four sets of guided notes and a word wall covering the following topics: Introduction to Probability, Sample Spaces, Independent and Dependent Events, Two-Way Tables, Mutually/Non-Mutually Exclusive Events, and Complements. The scaffolded notes provide an extra opportuni
Subjects:
Grades:
6th - 12th
CCSS:
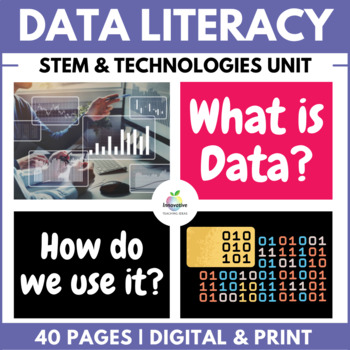
Data Literacy in STEM & Digital Technologies | Numerical, Categorical & Digital
Enhance your student's understanding of DATA LITERACY and DIGITAL LITERACY What is Data? Why it's important? How do numerical, categorical, and digital data fit within STEM and DIGITAL TECHNOLOGIES?Well, look no further... This bundle contains everything you need to teach the essentials of DATA LITERACY with absolutely NO PREP REQUIRED.CoveringNumerical DataCategorical DataDigital DataData collectionData analysisData Sorting and FilteringData visualization and representationBinary, QR and more
Grades:
3rd - 10th, Adult Education, Staff
Types:
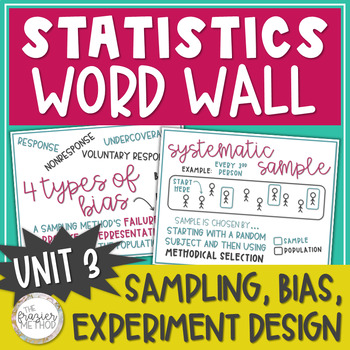
Statistics Word Wall Posters Sampling Methods, Bias, Experiment Design AP Unit 3
Use these Statistics Posters to add high school math classroom decor to your bulletin board, hallway, math word wall, or classroom door with these great 8.5" by 11" Statistics Word Wall pages of SAMPLING METHODS, TYPES OF BIAS, & EXPERIMENTAL DESIGN vocabulary! Put them up one at a time as you teach through each term or display them all at once. 34 PAGESALL PAGES ARE IN COLOR & GRAYSCALE.SIZE: 8.5 x 11 inches All vocabulary terms are from Unit 3: Collecting Data in AP Statistics, and the
Subjects:
Grades:
10th - 12th
Showing 1-24 of 158 results


