26 results
5th grade graphing poster microsofts
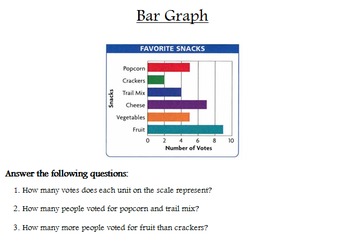
Interpreting Graphs Posters (Line Plot, Bar Graph, Line Graph, Etc)
Students practice interpreting several types of different graphs including line plot, bar graph, line graph, pictograph, double line graph, histogram, circle graph, and stem-and-leaf plot. Poster size sheets, so you can have students rotate in small groups or use in a math center. Answer key is included. I have a free graphic organizer that you can download that will help students learn about the different types of graphs first. Check it out!
Grades:
3rd - 7th
Types:
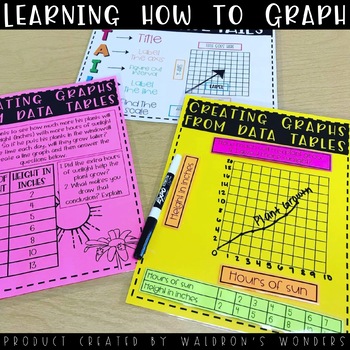
Learning How to Graph
In this product you will find:-How to graph power point to go over the TAILS graphing procedure-Printable 8.5x11 posters for the students to use as a reference to use TAILS-A cut out of TAILS for their interactive notebooks-Creating graphs from word problems and data tables practice (6 different full page printables)-Creating graphs from data tables printables manipulatives (cut and glue/velcro/magnets etc. See product pictures for how I made them with Velcro!-Independent practice (could be a qu
Subjects:
Grades:
4th - 12th
Types:
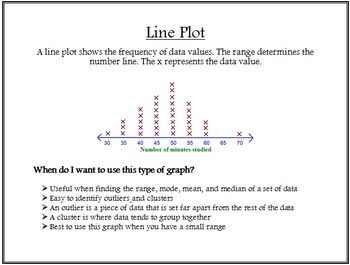
Types of Graphs Posters
Students will explore a variety of different types of graphs and learn about the characteristics and advantageous traits of each type. These posters include the following types of graphs: bar graph, line graph, pictograph, circle graph, line plot, histogram, stem-and-leaf plot, and double line graph. You can display these posters in your classroom for student reference. You can also download my free product named "Types of Graphs Graphic Organizer" and use the posters to help students explore th
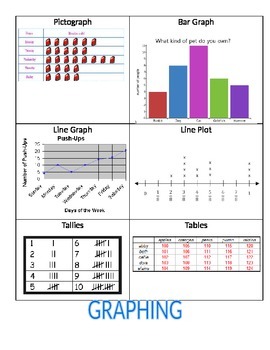
Graphing anchor chart
This small chart will help students remember the types of graphs.
Grades:
3rd - 6th
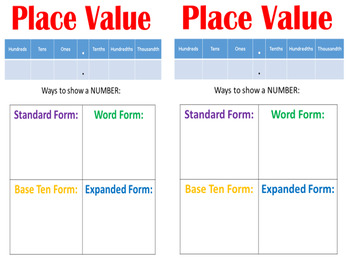
5th Grade Interactive Math Anchor Charts
I created this product because I was really bad at doing Math anchor charts in my class because I am OCD and don't like to put messing things on my classroom walls. I created this to help me guide my students to understand all of the TEKS they need for the STAAR. However, this can also be used for Common Core.
Within this product is a PowerPoint of Interactive Slides of the anchor charts. Another PowerPoint with slides that have the answers so you can turn into posters if your school has a pos
Subjects:
Grades:
3rd - 6th
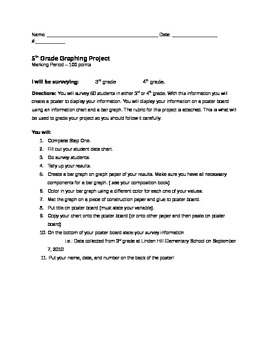
Graphing and Surveying Project
A graphing and Surveying Project for students to get a better idea of how to create different types of graphs. I have used this with fourth and fifth grades and it was fantastic!
The attachment includes: Step by Step directions for the project, a brainstorming sheet, a chart to take the survey on, a written response sheet, and a rubric to grade students.
Graphing and Surveying Project is licensed under a Creative Commons Attribution 3.0 United States License.
Subjects:
Grades:
3rd - 6th
Types:

Easy Math Classroom Assessment Tracker - Excel Bar Graph Formulas Pre-Loaded
This Excel file includes classroom Math proficiency trackers for schools with Pre-Tests, two or three Benchmark Assessments, and a Post-Test compared to district averages. I've also included a how-to tab and a completed example.
The file defaults to a Galileo Achievement tracker... but it is easy to edit the text if your school conducts other standardized assessments.
In just two easy steps you'll have a great visual prepared for your students:
Step 1: Enter data in the % Proficient boxes
St
Subjects:
Grades:
1st - 8th
Types:
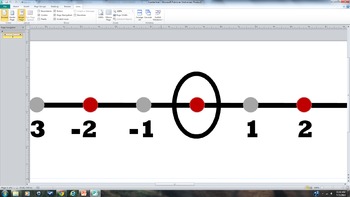
Printable Banner Number Line from -18 to +18 Red, Black and Tan
Printable Banner Number Line from -18 to +18 Red, Black and Tan Print out this Microsoft Publisher File, and you will have your own custom number line! This one is black, red and tan. I made this to fit the decorating needs of my middle school classroom! It will not distract students, but is very visually appealing from anywhere in the room.
Grades:
4th - 12th
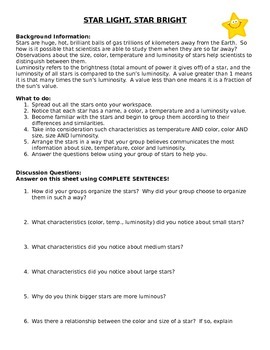
Star Light, Star Bright
The beginning of this activity was not created by me, but the manipulative extension for it was. In this activity the purpose is for students to categorize the star cards into similar groups. Students may choose to use Color, Luminosity, Magnitude, or Temperature. In the first sheet of the handout there are questions about how and why they grouped the stars the way the did. There are also follow up questions making relationships about all four categories. The second part of the activity has
Subjects:
Grades:
5th - 9th
Types:
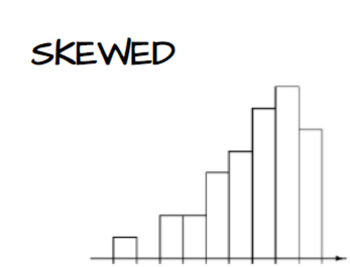
Shape of Histogram Posters
Print the following on colored paper to hang as reference for shapes of histograms.Skewed, Symmetric, and Uniform.
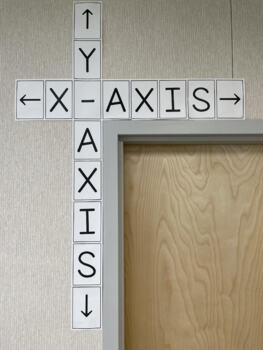
Axis Labels
Create an axis in the corner or your room (whiteboard, door frame, etc).
Grades:
5th - 12th
Types:
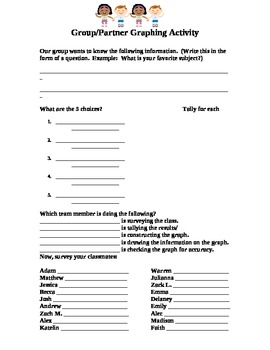
Cooperative Group Graphing Project
Students will work in cooperative groups to determine a questions on which they would like to poll the class. Each team member will have a specific job to do.After the poll and tally the results, students will create a large graph to display their data. A grading sheet is included.
Grades:
4th - 6th
Types:
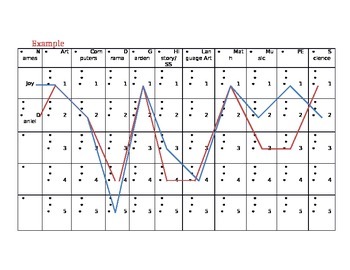
Subject Preferences Graph
This is a beginning of the year activity.
Getting to know your students and gaining insight to the overall trends of your year ahead.
This is a two-part task; first your students will find the trends in their table groups (small groups of 4 – 5 students). Second, you will graph the student data on a long poster or pin board. After each of the two tasks, students share three+ truths about the graphs.
Grades:
4th - 6th
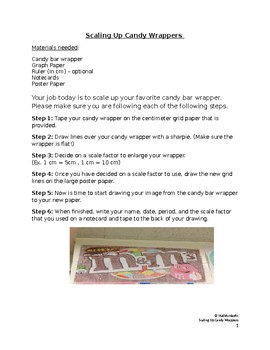
Scale Up Candy Wrappers
You will be using Candy Bar Wrappers to have students practice scaling up.
Subjects:
Grades:
5th - 8th
Types:
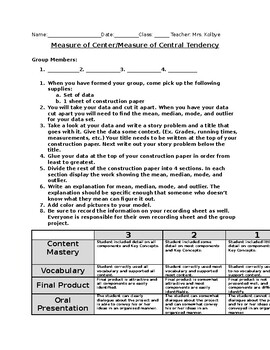
Measure of Center Practice
Here is an activity you can do with your students after introducing mean, median, mode, and outlier. It is designed to be a group assignment they can complete in one class period. I had my students present them the following class period. You can make up your own data set.
Subjects:
Grades:
5th - 7th
Types:
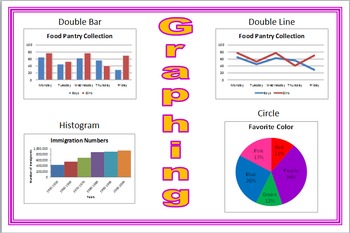
Silent Teacher Poster Types of Graphs
This is a large (2'x3') poster that shows the four most commonly made graphs in upper elementary and middle school math classes, Double Bar, Double Line, Histogram, and Circle (pie). The file is ready to be printed and laminated or can be easily re-sized to fit your needs.
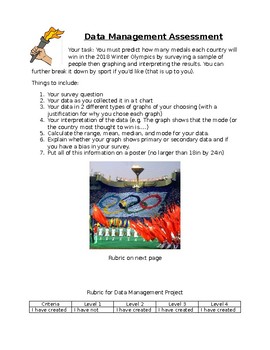
Data Management Assessment- Olympic Theme
This is aligned with grade 6-7 Ontario curriculum for Math. It also encompasses a connection to the Olympics. There is an instruction sheet and rubric posted with this assessment.
Grades:
5th - 7th
Types:
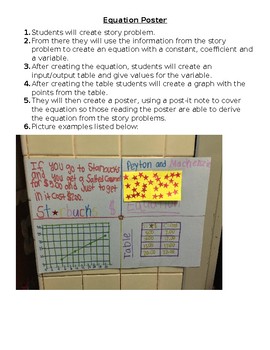
Equation Poster
Students will create their own equation, input/output table, and graph. They will then create a poster with this information.
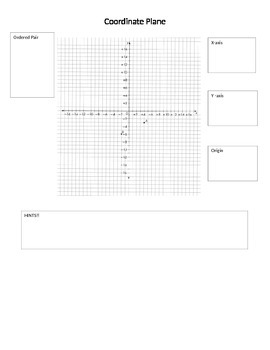
Coordinate Plane mini anchor chart
This interactive anchor chart will help students use a coordinate plane.
Grades:
4th - 6th

Classroom Jobs Apple Grid
Here is a fun way to assign classroom jobs and at the same time teach or reinforce graphing skills.
Subjects:
Grades:
K - 6th
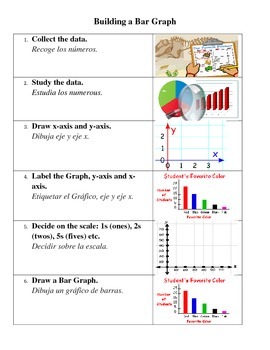
Building a Bar Graph anchor chart
Anchor chart to be used when you teach students the process of building a bar graph.
By ESLWorld
Subjects:
Grades:
2nd - 6th
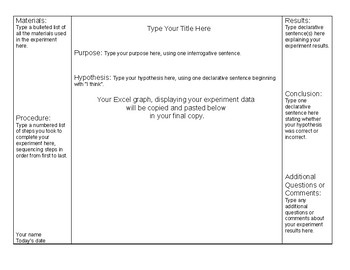
Scientific Method Mini Trifold Board Template
Students can create mini trifold boards, to display any science experiment using the Scientific Method format with this Word document template.
Teachers can save and share this with their students using public file storage available on school servers, Google Drive, etc.
This classroom-tested template was used for a Valentine Candy Heart Investigation project I developed. Student sample work may be viewed on my classroom web site here:
http://www.mrsdingman.com/Vday_Mini_Tri-Fold_Julia.pdf
htt
Subjects:
Grades:
5th - 8th
Types:
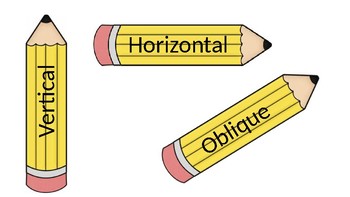
Horizontal, Vertical, Oblique Poster
This poster displays pencils turned horizontal, vertical, and oblique. Pencils can be cut out if you choose.
Subjects:
Grades:
1st - 8th
Showing 1-24 of 26 results


