5 results
High school measurement simulation pdfs
Line of Best Fit and Scatterplots
Who doesn't love a good mystery?!!!! In this engaging students use a real life scenario to apply scatterplot data of shoe size and height and the line of best fit to capture the correct suspect. This product has lots of great reviews! Many middle school math teachers state this was a great way to review the concept of line of best fit and scatterplots. Aligned to CCSSM8.SP.A.2 and CCSSM8.SP.A.3This activity is also available in a bundle at a discounted rate:Scatterplots and Line of Best
Subjects:
Grades:
7th - 9th
Types:
Also included in: Line of Best Fit and Scatterplots: The Bundle
Scatterplots and Line of Best Fit
This engaging activity allows students to apply their knowledge of slope, scatterplot data, and line of best fit to figure out how tall Sasquatch is. Taking the role of engineers, students use a foot print of sasquatch to approximate his height which is needed to construct a trap. An engaging newspaper article sets the scene of the recent Sasquatch sightings at the local park. This activity is also available in a bundle at a discounted rate:Scatterplots and Line of Best Fit BundleAligned to C
Subjects:
Grades:
7th - 9th
Types:
Also included in: Line of Best Fit and Scatterplots: The Bundle
T. Swift & Metrics- A Problem-Based Learning (PBL) Activity
I came up with this activity to teach the metric system to my gifted students. The problem centers around Taylor Swift going on tour and requiring some information from my students. You could definitely change the artist to someone more popular with your group of kids.
I posed the problem to them by having them read the situation titled "A Diva's Crisis." Then, they were assigned to groups and brainstormed a list of questions to put in the "W" section of a KWL chart (a teacher answer key is
Subjects:
Grades:
6th - 10th
Types:
Micro:bit remote temperature sensor data collection with progress bar
This lesson gets temperature sensor data from the built-in sensor. The lesson uses two Micro:bits. One collects temperature data and the other receives the data. The data is collected and saved to a comma-separated value file.The code uses the Micro:bit’s radio to transmit the data. Use this to discuss how radio technology works. Radio technology uses frequencies. Frequencies are measured in amplitude and modulation. Discuss how amplitude and modulation are used to send information like music an
Grades:
3rd - 12th, Higher Education, Adult Education, Staff
Types:
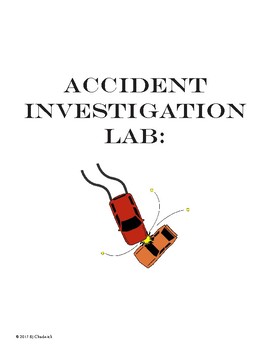
Accident Investigation Lab for Trig Students
A lab exercise in which students complete a simulation of investigating a vehicle accident by measuring the length of skid marks and calculating the speed of the braking vehicle. Students will measure the length using the number of revolutions and diameter of a rolling rotary device (such as sewing tracing wheel or pizza cutter.) This lab is designed for groups of 2 - 4 students and contains 5 different scenarios of the accident so different groups can analyze different situations. These mat
Subjects:
Grades:
10th - 12th
Types:
Showing 1-5 of 5 results


