53 results
12th grade algebra simulations
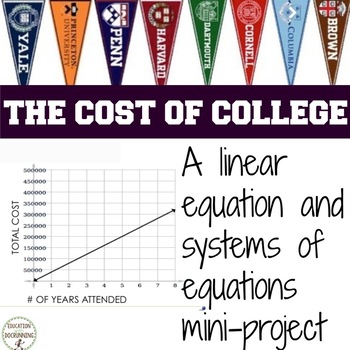
Linear Equations Project Cost of College
Bring real-world applications that are relevant to students with this linear equations project on college costs. Students examine the cost of individual colleges and compare colleges using linear equations. For students ready for systems of equations, students evaluate the impact of grant money on the overall cost. Great to get students thinking about and researching colleges now! Included in this resource:- Ready-to-use student pages- Teacher's Guide- Answer Key- Separate powerpoint file w
Subjects:
Grades:
10th - 12th
Types:
CCSS:
Also included in: Algebra 2 Curriculum
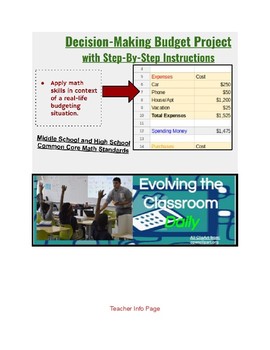
Budget Spreadsheet Project (personal finance & math skills)
A step-by-step project with detailed instructions on how to set up an Excel spreadsheet budget. Students will apply math skills in context of a real-life budgeting situation.
Students will create a budget:
-Based on their future career choice.
-Independently by following the instructions using an Excel Spreadsheet.
-Over the course of at least 2 class periods (typically students take at least 2.5 hours to complete this project).
Subjects:
Grades:
6th - 12th
Types:
CCSS:
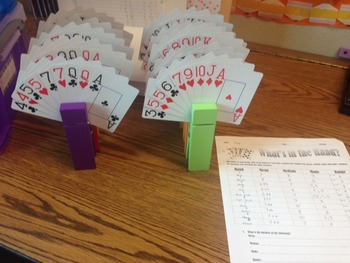
Statistics Mode, Median, Mean, Range Worksheet for Math or Psychology
What's in the Hand: Activity makes learning mode, median, mean, and range fun. You will need two packs of playing cards in order to use 10 different variations. I use giant clothes pins to hold a total of 9 cards for each station. Each student gets a worksheet and is assigned to a group of 4-5 students. Students will complete the first rotation by figuring the mean, median, mode, and range, and then rotate to each other station in about 5 min intervals. At the end they will answer the questions
Subjects:
Grades:
5th - 12th
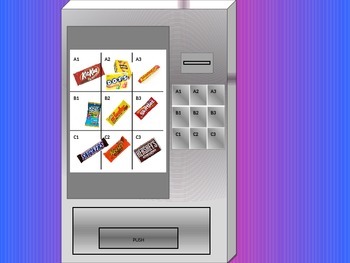
Non Functional Vending Machine
This powerpoint is used to engage students before learning about functions. When you click on a number it will go to the coresponding candy. If you press the push button on the machine it will lead you to a table. The A2 button is special, if you click on the A it will lead to the Pops candy. If you click on the 2 it will lead to the Dots. (This is the non function part) You can ask the students is this a functional vending machine. They will say no because when you pressed the A2 button you got
Grades:
9th - 12th

Predicting Population Size Lab Activity - New and Improved!
Egg Ecology is a great way to bring some math into your biology class.
In this lesson, students get to use the capture and recapture method on a population of wild plastic eggs that have been dispersed through the classroom habitat.
This lesson is perfect for:
1. Learning about population ecology
2. Seeing how mathematical models can be applied to real-life biology problems.
3. Testing a mathematical model to see how reliable it is
4. Discussing assumptions and limitations of mathematical mod
Subjects:
Grades:
7th - 12th
Types:

Concession Stand - A Full Unit Business Simulation
Concession Stand is a business simulation for grades 8 - 12. Students will open a business and use their math skills to complete order forms, update inventory, pay bills, keep a ledger, and open for days of sale. This project works with higher level Blooms Taxonomy and allows students to work together in groups.
Subjects:
Grades:
8th - 12th
Types:
GPS Simulation - Applications of Algebra and Geometry - Aligned with Numb3rs
Are you tired of hearing your students say "When would you ever use this!?" This lesson is a perfect way to silence their complaints!
I originally designed this lesson to be used after watching the episode "Convergence"of the CBS television series Numb3rs. I think every middle/HS teacher should own copies of this series. If you aren't familiar with the show, it is basically a crime show where the characters solve crimes with math. (Similar to CSI) You might be able to download free episodes
Grades:
8th - 12th
Types:
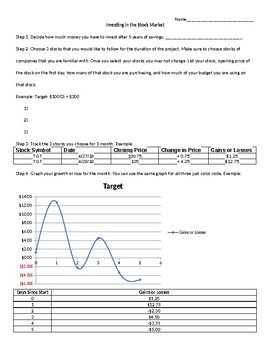
Investing in the Stock Market
This project was created for a consumer math class. It has the students selecting 3 stocks, and buying different amounts based on their budget (I chose budgets and had them draw from a hat). Students will then track the 3 stocks for a month (I have them back track dates on Yahoo! Finance's History tab), and then graphing their gains or losses. Students will then finish by summarizing their month.
Subjects:
Grades:
9th - 12th
Types:
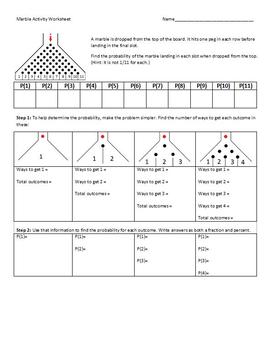
Marble Activity
Fun activity to have students investigate and calculate probability.Using a Plinko-style board, students predict where the marble will drop. Probabilities are then found by breaking the board down into smaller versions and seeing how it relates to Pascal's Triangle to be able to determine the probabilities.There are questions related to the marble drop and probability, some questions about Plinko and an extension using The Wall game show.SMART Notebook presentation, word document and pdf version
Subjects:
Grades:
7th - 12th
Types:
CCSS:
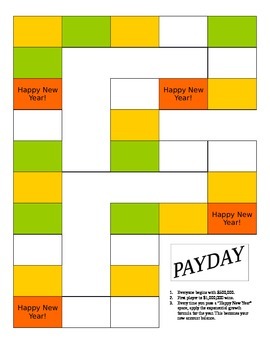
Payday - Exponential Growth Board Game for Algebra
Payday is an awesome interactive board game similar to the game of Life. Students start with $400,000 and life events cause them to gain or lose money. At the end of each year, students calculate the yearly exponential growth to get their new balance. The first student to $1,000,000 wins.
Students are involved and excited to play this game. This is a good formative assessment tool to see if student understand this algebraic topic. The student score sheet is a way to collect their work and asse
Subjects:
Grades:
9th - 12th
Types:
CCSS:
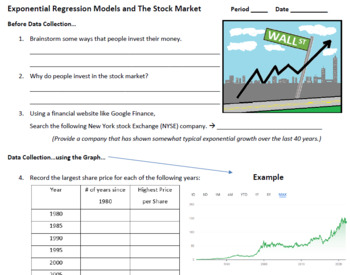
Exponential Regression Stock Market Project
Using free online stock graphs, students will explore exponential growth for various companies. An exponential regression model will allow students to make predictions and find out how much money they would make off of a stock at retirement age. This mutiple-day activity is rich with Algebra 2 and Precalculus topics!
Subjects:
Grades:
9th - 12th
Types:
CCSS:
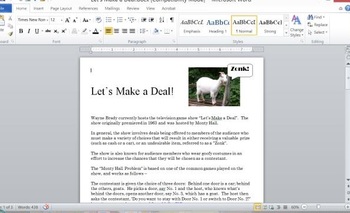
Monty Hall Problem with Fathom Simulation
A guided handout (Word document) and a Fathom Simulation file that introduces students to the famous "Monty Hall Problem" and guides students to the discovery that switching doors is always preferred!
Subjects:
Grades:
7th - 12th
Types:
FREEBIE - Templates: Group Generator, Name Chooser, Timer, Activity, ... etc.
This Smart Notebook file contains tools that are helpful to use in managing the classroom. A "Group Generator" tool allows you to generate as many groups as you wish. A "Word Chooser" tool allows you to pick on a student for an answer at random. A "Timer" allows to manage your class time effectively. Different type of timers are also included such as firecracker. Also, for those who are teaching probability, an interactive die, spinner, and card are also available in this template file.
Si
Subjects:
Grades:
PreK - 12th, Higher Education, Adult Education, Staff
Types:
Algebra 1 EOC 2018-19 Practice Test
This multiple choice (5 options per questions) exam has been formulated to conform to the latest standards and will help students gauge how well they are prepared to take the EOC in 2018-19. There are 60 questions including questions on Statistical Models. There are also some free response questions.
Subjects:
Grades:
8th - 12th
Types:
Twizzler Linear Regression Lab
Students are asked to eat a Twizzler and record the length after each bite. Students will then create a linear model based off of their data and answer some questions about the model.Concepts mentioned:-Data collection-Graphing from a table-Building a Linear Model-Predicting using a linear model-Interpreting slope and y-intercept of a linear function-Creating and describing reasonable domain and range
Subjects:
Grades:
9th - 12th
Types:
Supply and demand
A classroom activity where student build their own demand and supply curves based on what they are willing to pay (or be paid) for a clean room. Students must reason quantitatively and use units common in economics to solve problems in market equilibrium. Algebra- linear equations, systems of equations, and functions.
Subjects:
Grades:
9th - 12th, Higher Education, Adult Education
Types:
CCSS:
Candy Statistics
Kids have a chance to open individual bags of M&Ms and practice calculating probability of different colors and solving probability problems both independent and dependent.
Subjects:
Grades:
9th - 12th
Types:
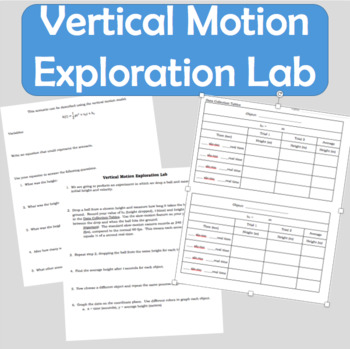
Vertical Motion Exploration Math Lab - Discovering through Inquiry
Do you have those students that always ask about how this relates to real life? This math lab is the solution. Students will work through an experiment just like they would in science class to discover through self-inquiry that vertical motion is best represented with parabolas and quadratic functions. The experiment allows students to discover this phenomena through inquiry and data collection. After collecting data, students will have their "a-ha" moment. Students will quickly be able to
Subjects:
Grades:
7th - 12th, Higher Education, Adult Education
Types:
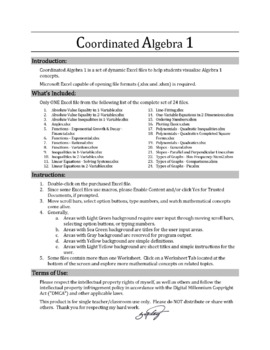
Demonstrate Line Fitting with an Animated Excel File
Simple to use animated Excel file for in class demonstration of Line Fitting using linear regression. Move scroll bars, select option buttons, type numbers, and watch these mathematical concepts come alive. You must use Microsoft Excel that is capable of opening file formats in either .xlsx or .xlsm.
Subjects:
Grades:
9th - 12th
Types:

Math in the News: Issue 107
In this issue of Math in the News we explore logarithmic functions to model the thawing of frozen turkeys. We look at USDA guidelines to determine data points and use a graphing calculator to create mathematical models.
This holiday-themed real-world application will create a unique context for exploring logarithmic functions.
Media4Math.com has thousands of additional digital resources for math.
Subjects:
Grades:
9th - 12th
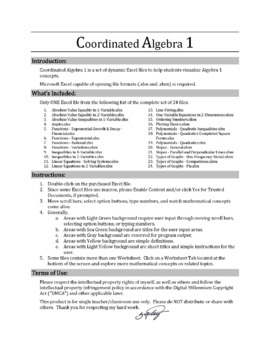
Demonstrate Exponential Functions with an Animated Excel File
Simple to use animated Excel file for in class demonstration of exponential function graphs, specifically, growth, decay, f(x)=ab^x, vertical shift, horizontal shift, and f(x)=ab^(x-h)+k. Move scroll bars, select option buttons, type numbers, and watch these mathematical concepts come alive. You must use Microsoft Excel that is capable of opening file formats in either .xlsx or .xlsm.
Subjects:
Grades:
9th - 12th
Types:

Systems of Equations Simulation
Explore solving systems of two linear equations using tables and graphs through this interactive smart board program. Students are put into a simulation of a submarine rescuing an injured diver.
Subjects:
Grades:
8th - 12th, Adult Education
Demonstrate Ordering Numbers with an Animated Excel File
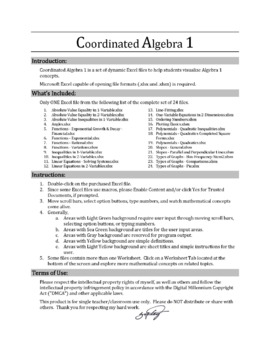
Simple to use animated Excel file for in class demonstration of Ordering Numbers from whole numbers, integers, positive rational, rational, and real numbers. Self-correcting quiz format that automatically generates a new set of numbers. Move scroll bars, select option buttons, type numbers, and watch these mathematical concepts come alive. You must use Microsoft Excel that is capable of opening file formats in either .xlsx or .xlsm.
Subjects:
Grades:
4th - 12th
Types:
Showing 1-24 of 53 results


