16 results
Common Core 6.SP.A.2 research for Microsoft OneDrive
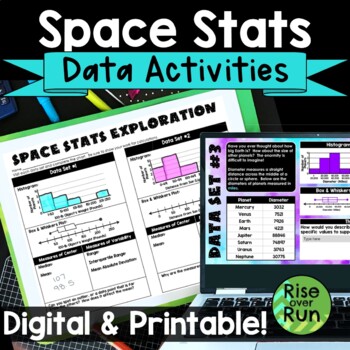
Box and Whiskers Plots and Histograms Activity with Real World Space Statistics
Use statistics for a real world application with this engaging activity about space stats! Students use real data to create histograms, box and whiskers plots, as well as calculate median, mean, range, interquartile range, and mean absolute deviation. This lesson works great for a space room transformation if you choose! Components are included in printable versions for in-person learning and Google Slides + Microsoft PowerPoint for online learning.Here’s what is included:Intro Presentation (Po
Subjects:
Grades:
6th - 9th
Types:
Also included in: Algebra 1 and 8th Grade Math Curriculum Bundle for Entire Year
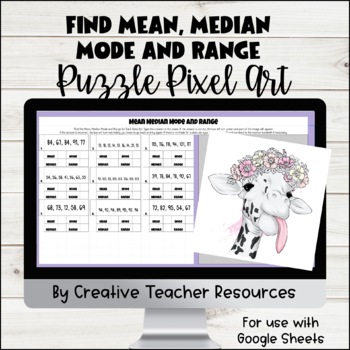
Find Mean, Median, Mode and Range DIGITAL Puzzle Pixel Art
Students will find the mean, median, mode and range for each data set in this self-checking activity. As the questions are answered correctly, the answers will turn green and parts of the puzzle will appear. This activity includes 9 self-checking problems that have students finding the mean, median mode and range for each given data set.If the question is answered incorrectly, the answer will turn red. No puzzle pieces will appear for that answer if it incorrect. This activity is ready to be use
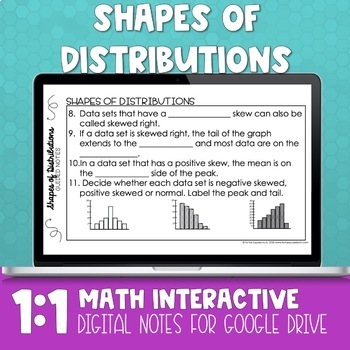
Shapes of Distributions Digital Math Notes
Shapes of Distributions 1:1 Interactive Math Notebook6.SP.A.2Are you looking for a way to engage your math students in a 1:1 device environment? Check out my line of 1:1 Interactive Math Notebooks! Included in this product: -Shapes of Distributions Guided Notes-Shapes of Distributions Practice Page-Shapes of Distributions Frayer Models for Vocabulary Practice-2 different warm-ups -2 different exit slips -Answer Keys*Please note that the download includes a link to the product and a tutorial for
Subjects:
Grades:
5th - 8th
Types:
CCSS:

Vacation Planning PowerPoint (No Prep, Print & Go)
This project lets students research the process of planning a vacation. They use actual websites (hotels.com, enterprise, and google flights) that we would to plan one. They budget their vacation. Also, research the weather and cuisine on their vacation. Afterward, have them create a presentation from their findings. You will get the powerpoint so you can edit it.
6 Editable Bar Graph Templates 2.0
Finally a simple and professional graph space that students can fill out without any design issues getting in the way. This file contains 6 ready-to-use graph options. Print them and have students fill them with pencil and ruler, or distribute them over computer and let them practice entering the data. Get a project perfect finish every time. Maybe you just want to fill it out live on a projector? The possibilities are endless! It's okay to say you love these bar graphs. So do we.Contains:- 2 bl
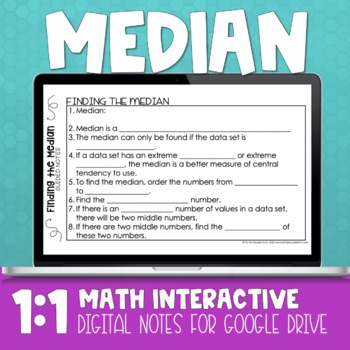
Median Digital Math Notes
Finding Median 1:1 Interactive Math NotebookAre you looking for a way to engage your math students in a 1:1 device environment? Check out my line of 1:1 Interactive Math Notebooks! Included in this product: -Median Guided Notes-Median Practice Page-Median Frayer Models for Vocabulary Practice-2 different warm-ups -2 different exit slips -Answer Keys*Please note that the download includes a link to the product and a tutorial for teacher use. This product is best used in Google Drive or Microsoft
Subjects:
Grades:
5th - 8th
Types:
CCSS:
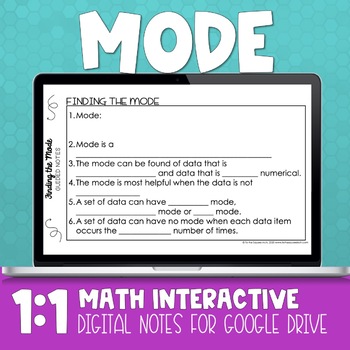
Mode Digital Math Notes
Finding Mode 1:1 Interactive Math NotebookAre you looking for a way to engage your math students in a 1:1 device environment? Check out my line of 1:1 Interactive Math Notebooks! Included in this product: -Mode Guided Notes-Mode Practice Page-Mode Frayer Models for Vocabulary Practice-2 different warm-ups -2 different exit slips -Answer Keys*Please note that the download includes a link to the product and a tutorial for teacher use. This product is best used in Google Drive or Microsoft One Driv
Subjects:
Grades:
5th - 8th
Types:
CCSS:
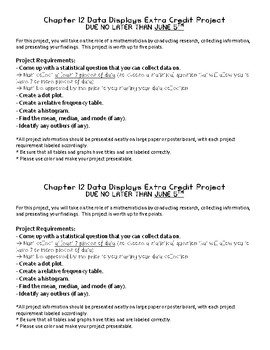
Probability Data Displays Project
This project was used as an extra credit project that ties in with chapter 12 of the 6th grade Go Math program. This project focuses on data displays, including dot plots, frequency tables, and histograms. This allowed students to create a statistical question, collect data, and present their findings. This product includes the directions sheet that I gave to my students, and then the students created posters that displayed the required information. There are two directions sheets per page i
Subjects:
Grades:
4th - 8th
Types:
Statistics Project
Use this product as a culmination of your statistics unit. Allow students to create their own question, survey their classmates, and analyze the results. This resource includes pages on - statistical questions - data collection - line plots - histograms- frequency tables - mean, median, mode, range- written conclusion - rubric
Subjects:
Grades:
5th - 7th
Types:
Also included in: Sixth Grade Math Bundle
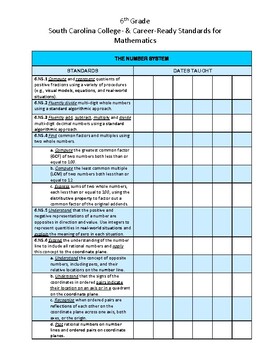
6th Grade South Carolina College and Career Ready Math Standards
This is a checklist that will allow an educator to track what 6th grade math South Carolina standards have been taught and when. This is a great contribution to a teacher or student data notebook. Each key concept is color coded as well as each objective.
Subjects:
Grades:
6th
Also included in: 6th, 7th, and 8th Grade Math SC standard checklist (Bundle Package)
Passion-Driven Statistics E-book (Introductory/AP Statistics Course Textbook)
Passion-Driven Statistics is an NSF-funded, multidisciplinary, project-based curriculum that supports students in conducting data-driven research, asking original questions, and communicating methods and results using the language of statistics. The curriculum supports students to work with existing data covering psychology, health, earth science, government, business, education, biology, ecology and more. From existing data, students are able to pose questions of personal interest and then use
Subjects:
Grades:
6th - 12th, Higher Education, Adult Education
Types:
SPSS software Secondary Data Analysis Workshop (Introductory/AP Statistics)
This handout is intended for those interested in teaching/learning basic introductory statistics concepts to analyze real data. Students will learn how to tell a story using secondary data analysis. The handout is for SPSS and the US Longitudinal Study of Adolescent Health data set. For handouts on the data set code book and raw data file, a PowerPoint to accompany the handout, or questions please email kristin.flaming@gmail.com or ldierker@wesleyan.edu.This handout was developed as a condensed
Subjects:
Grades:
6th - 12th, Higher Education, Adult Education
Types:
STATA software Secondary Data Analysis
This handout is intended for those interested in teaching/learning basic introductory statistics concepts to analyze real data. Students will learn how to tell a story using secondary data analysis. The handout is for STATA software and the US Longitudinal Study of Adolescent Health data set. For handouts on setting up an account, the data set code book and raw data file, a PowerPoint to accompany the handout, or questions please email kristin.flaming@gmail.com or ldierker@wesleyan.edu.This
Grades:
6th - 12th, Higher Education, Adult Education
Types:
SAS software Secondary Data Analysis Workshop (Introductory/AP Statistics)
This handout is intended for those interested in teaching/learning basic introductory statistics concepts to analyze real data. Students will learn how to tell a story using secondary data analysis. The handout is for SAS (email for R, SPSS, Stata, & Python), a free cloud based system and the US Longitudinal Study of Adolescent Health data set. For handouts on setting up a free SAS account, the data set code book and raw data file, a PowerPoint to accompany the handout, or questions please e
Grades:
6th - 12th, Higher Education, Adult Education
Types:
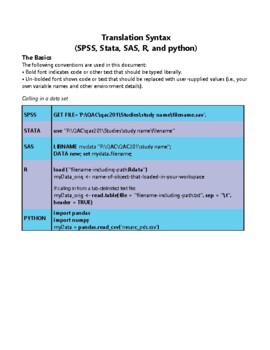
Translation Code
As part of our NSF-funded passion-driven statistics project, we have just started to share more widely our “translation code” aimed at supporting folks in learning code-based software and in moving more easily between them. The pdf includes all of the basic syntax for managing, displaying and analyzing data, translated across SAS, R, Python, Stata and SPSS. http://bit.ly/PDSTranslationCode.For more information about our warm and welcoming data-driven curriculum, check out https://passiondrivenst
Grades:
6th - 12th, Higher Education, Adult Education
Types:
R software Secondary Data Analysis Workshop (Introductory/AP Statistics)
This handout is intended for those interested in teaching/learning basic introductory statistics concepts to analyze real data. Students will learn how to tell a story using secondary data analysis. The handout is for R or R Studio, a free cloud based system and the US Longitudinal Study of Adolescent Health data set. For handouts on setting up a free R account, the data set code book and raw data file, a PowerPoint to accompany the handout, or questions please email kristin.flaming@gmail.com or
Subjects:
Grades:
6th - 12th, Higher Education, Adult Education
Types:
Showing 1-16 of 16 results

