16 results
Common Core 8.F.B.5 laboratories
Scientific Thinking Unit Bundle
3 fully editable, NGSS/modeling pedagogy aligned worksheets, 4 inquiry labs, 3 lab challenges, 2 quizzes, 6 guided notes/reading assignments, 1 unit review, 1 writing assignment, 1 equation toolbox, and 1 curriculum guide!WorksheetsThere are a variety of free response questions for most worksheets, which are usually one or two pages long. Worksheets are used for students to deploy models developed from inquiry labs and as a way to practice problem-solving en route to mastery of learning targets
Subjects:
Grades:
7th - 12th
Types:

Concept Comparison: Graphs in Science (Categorical vs Numerical)
How do scientists use graphs? This concept comparison helps students contrast bar graphs, pie charts and line graphs created from categorical and numerical data. The recall device uses DRY MIX and TRAILS as acronyms to help Ss remember how variables are plotted on a graph, and standard format for a graph. The frame comparison helps students contrast rate of change, slope shape and written relationships of functions (y vs. x; y vs. x^2; y vs. 1/x, and so on). THREE (3) activities are included:ha
Subjects:
Grades:
6th - 12th
NGSS:
HS-ETS1-3
, MS-ETS1-3
Also included in: StayGiant Physics Bundle: Measurement
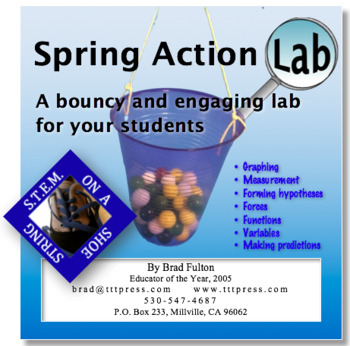
Spring Action Lab: A Bouncy and Engaging STEM Lab
Students will enjoy putting their learning to work in this engaging lab. Using springs or rubber bands, students measure and record data as they try to get a bucket to touch the floor by adding weights. Then they use their data and its graph to make predictions and write equations that will help them predict the outcomes. This simple and inexpensive lab will help your students learn graphing, t-tables, measurement, linear functions, and the physics of tension forces. This can be used as a stand-
Subjects:
Grades:
5th - 9th
Types:
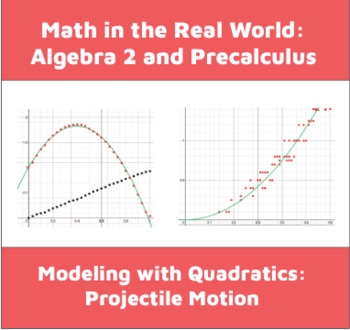
Quadratic Projectile Motion Lab with Data Set
In this activity, students analyze two different data sets that describe how projectiles fly through the air. The first describes the flight path of a thrown ball and the second describes the distance traveled by a ball dropped off a building over time. Using desmos.com, students fit linear and quadratic models to discover which quantities are related linearly (time and horizontal distance traveled) and which are related quadratically (time and vertical distance traveled.) They are asked to inte
Subjects:
Grades:
8th - 12th
CCSS:
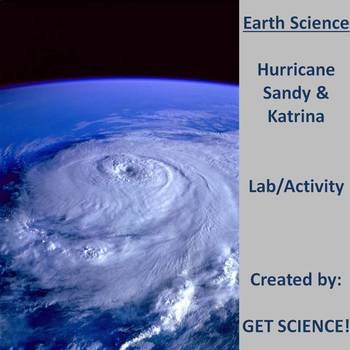
Tracking Hurricane Sandy!
This 6 page lab activity will help students remember where hurricanes form and why. The lab explores the differences and similarities between Hurricane Sandy and Hurricane Katrina. Students will practice their skill of plotting using latitude and longitude as they plot the tracks of both. The Saffir-Simpson scale will be used as students analyze data from both storms. Students will plot pressure vs. wind speed to understand the relationship and answer questions based on the data and general h
Subjects:
Grades:
7th - 12th
Types:
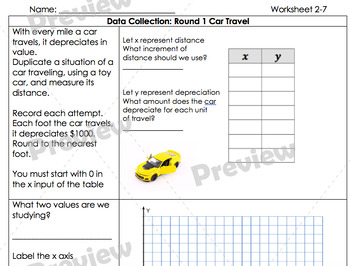
Investigating Linear Graphs
I built this discovery lesson so that students would learn, hands-on, how to build a graph based on data they collected from their own investigation. Materials you will need for this lab include a set of cups that are stackable and several small toy cars. For this task you will need:Toy carsCupsMarshmallows
Subjects:
Grades:
6th - 9th
Types:
Human Population Graphing Lab
This simple yet effective lab allows students to strengthen their graphing skills using real word data. Students will deal with larger numbers as they see the exponential growth of the global population.Students will practice rate of change problems and scientific notation. Students will also make observations and inferences on their findings.You may edit this lab. Answer key and Graph Paper provided. Website for current world population in real time provided.Educating the World Together!
Subjects:
Grades:
6th - 12th
Types:
01 - Density Lab Summary
Fully editable, NGSS/modeling pedagogy aligned inquiry lab summaries! Most lab summaries consist of 2 pages total, with space for students to provide the following information:Lab investigation purposeData for the independent and dependent variableWritten statement on data trendsSketch of a graphical model using a line of best fitLinear equation to mathematically model the relationship between the variablesAnalysis of physical meanings of slope and y-intercepts Space to list tools used and a bri
Subjects:
Grades:
7th - 12th
Types:
Also included in: Conceptual Physics Inquiry Labs
01 - Marbles Lab Summary
Fully editable, NGSS/modeling pedagogy aligned inquiry lab summaries! Most lab summaries consist of 2 pages total, with space for students to provide the following information:Lab investigation purposeData for the independent and dependent variableWritten statement on data trendsSketch of a graphical model using a line of best fitLinear equation to mathematically model the relationship between the variablesAnalysis of physical meanings of slope and y-intercepts Space to list tools used and a bri
Subjects:
Grades:
7th - 12th
Types:
Also included in: Conceptual Physics Inquiry Labs
X vs Y: A Variable Recording and Graphing Lab
A 3 day to week long laboratory exploration into independent and dependent variables, and how equations like y=mx+b can describe the relationships between them.After breaking down the lab's instructions, students will get to choose their own x and y variables and then come up with a procedure for gathering data. Depending on how outgoing/creative they are, collecting the data for this lab can be a blast! Once they have 20 (x,y) samples, they will graph them and draw a line that fits the data. Th
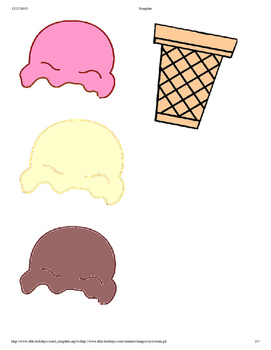
My Own Ice Cream Cone: Slope Activities 1
Introductory lesson to using data to create a linear growth graph and model by building "fake" ice cream cones. Templates are included for the cones and scoops. Instructions for the teacher are also included. Contact me at hrudolph@orangecsd.org for details or clarification. Students will be introduced to appropriate vocabulary such as initial amount, slope, intercept, growth, increasing, model, trend, linear function or linear equation. Lamination is helpful for re-using the materials! A
Subjects:
Grades:
5th - 8th
Types:
01 - Density PhET Simulation Lab Challenge
Fully editable, NGSS/modeling pedagogy aligned summative lab challenge! Most lab challenges consist of 2 pages total, with space for students to provide the following information:Known variables and valuesDiagrams of any models utilizedCalculations for any unknown valuesTools used and a brief description of collecting and analyzing dataReflectIons on the validity of the data by discussing error and data methodsWritten explanation of generated solutionLab challenges are used for students to deplo
Subjects:
Grades:
7th - 12th
Types:
Also included in: Conceptual Physics PhET Simulations
01 - Density PhET Simulation Summary
Fully editable, NGSS/modeling pedagogy aligned inquiry lab summaries! Most lab summaries consist of 2-3 pages, with space for students to provide the following information:Lab investigation purposeData for the independent and dependent variableWritten statement on data trendsSketch of a graphical model using a line of best fitLinear and quadratic equation to mathematically model the relationship between the variablesAnalysis of physical meanings of slope and y-interceptsSpace to list tools used
Subjects:
Grades:
7th - 12th
Types:
Also included in: Conceptual Physics PhET Simulations
01 - Marbles Mystery Mass Lab Challenge
Fully editable, NGSS/modeling pedagogy aligned summative lab challenge! Most lab challenges consist of 2 pages total, with space for students to provide the following information:Known variables and values Diagrams of any models utilized Calculations for any unknown valuesTools used and a brief description of collecting and analyzing dataReflectIons on the validity of the data by discussing error and data methodsWritten explanation of generated solutionLab challenges are used for students to dep
Subjects:
Grades:
7th - 12th
Types:
Also included in: Conceptual Physics Lab Challenges
01 - Density Bottle Lab Challenge
Fully editable, NGSS/modeling pedagogy aligned summative lab challenge! Most lab challenges consist of 2 pages total, with space for students to provide the following information:Known variables and values Diagrams of any models utilized Calculations for any unknown valuesTools used and a brief description of collecting and analyzing dataReflectIons on the validity of the data by discussing error and data methodsWritten explanation of generated solutionLab challenges are used for students to dep
Subjects:
Grades:
7th - 12th
Types:
Also included in: Conceptual Physics Lab Challenges

Projectile Motion Quadratics Lab
In this activity, students analyze two different data sets that describe how projectiles fly through the air. The first describes the flight path of a thrown ball and the second describes the distance traveled by a ball dropped off a building over time. Using desmos.com, students fit linear and quadratic models to discover which quantities are related linearly (time and horizontal distance traveled) and which are related quadratically (time and vertical distance traveled.) They are asked to inte
Subjects:
Grades:
8th - 12th
CCSS:
Also included in: Quadratic Projectile Motion Lab with Data Set
Showing 1-16 of 16 results

