11 results
Common Core HSS-ID.B.5 internet activities
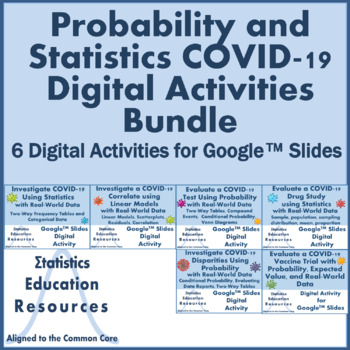
Bundle: Probability and Statistics COVID-19 Digital Activities (Common Core)
Bundle: Probability and Statistics COVID-19 Digital Activities (Common Core) This product is a bundle that includes 6 digital activities that were created in Google™ Slides. Each activity includes a background context relevant to COVID-19, summaries of real-world COVID-19 data derived from international or national health organizations or published research reports, detailed answer key, and instructions for accessing the activities. These activities are very challenging, focused on statistical
Subjects:
Grades:
9th - 12th
Types:
CCSS:
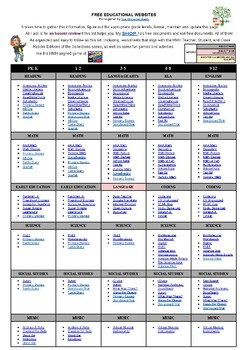
FREE EDUCATIONAL WEBSITES LIST 4 ALL GRADES K-12 AND SUBJECTS + TEACHER RESOURCE
Sometimes, you just need a list of websites for everyone. Here it is. FREE EDUCATIONAL WEBSITES Put together by Teach Me, Maria!It takes time to gather this information, figure out the appropriate grade levels, and format, maintain, and update this page. All I ask is for an honest review if this list helps you.
Subjects:
Grades:
PreK - 12th, Staff
Types:
Investigate COVID-19 using Statistics with Real-World Data
Distance Learning: Investigate COVID-19 using Statistics with Real-World Data (Common Core) This digital activity created in Google™ Slides involves analyzing real surveillance data on COVID-19 as a member of a team of scientists. Students will convert a summary of categorical data into a two-way frequency table. Next, students will investigate the relation between two variables within a population of adults hospitalized with COVID-19. COVID-19 has directly affected students’ lives and presents
Subjects:
Grades:
8th - 12th
Types:
CCSS:
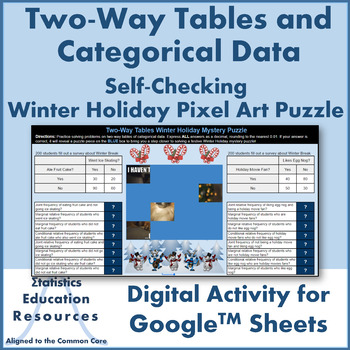
Two-Way Tables Categorical Data Winter Holiday Pixel Art Puzzle (Common Core)
This digital Winter Holiday pixel art puzzle created in Google™ Sheets involves computing marginal, joint and conditional relative frequencies as well as marginal and joint frequencies from two-way tables. Students practice computing and interpreting frequencies and relative frequencies while solving a festive Winter Holiday puzzle.This fun twist on worksheets engages students by allowing them to independently solving a festive Winter Holiday puzzle as they reinforce statistics concepts. This a
Subjects:
Grades:
8th - 11th
Types:
CCSS:
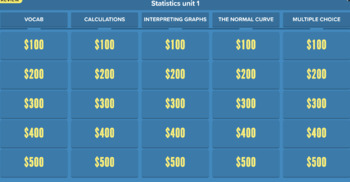
AP stats Unit 1 review jeopardy-style game
Included in purchase is the answer key in order (Category 1 $100-500, category 2 $100-500, etc.) and the link to the jeopardy game website. Membership is not needed to play on the website, but you will need to upgrade to pro on their site if you want the buzzer mode (not necessary but fun if your students are very competitive) follows Unit one vocab and example problems of AP Statistics (Categorical and quantitative data, normal curve)
Subjects:
Grades:
11th - 12th
Types:
CCSS:
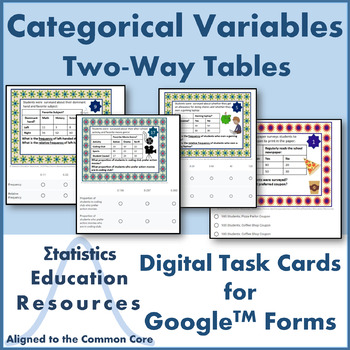
Digital Task Cards for Categorical Data and Two-Way Tables
Categorical Variables and Two-Way Tables Digital Task Cards (Common Core Aligned) These digital task cards are adapted from the printable version of the Categorical Variables and Two-Way Tables Task Cards available here. This product includes 20 task cards created with Google™ Forms: 4 task cards on marginal frequency and joint frequency 8 task cards on relative frequency and joint relative frequency 8 task cards on conditional relative frequencyThese digital task cards are perfect for distanc
Subjects:
Grades:
8th - 12th
Types:
CCSS:
Also included in: Bundle: Algebra I Statistics Digital Task Cards (84 Cards)
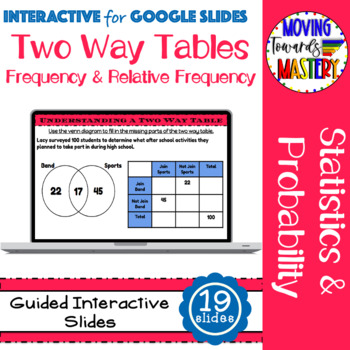
Two Way Frequency Tables Guided Interactive Digital Lesson & Practice Activity
Extensive ALL digital guided lesson for constructing and interpreting two way frequency tables. This interactive lesson provides slides for teaching and practice.The slides are scaffolded to build understanding. Students will progress from identification of terms to analyzing data involving bivariate data. The guided slides will begin with identification, move towards assisted analysis, and conclude with independent practice.Slides include...♦ Definitions♦ How to Construct a Two Way Table♦ How t
Subjects:
Grades:
8th - 10th
Types:
CCSS:
Also included in: Middle School Math Digital Guided Interactive Lessons
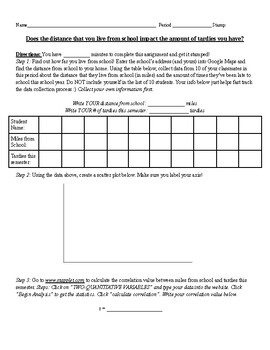
Correlation and Least Squares Regression Line Activity: High School Statistics
Hi! This activity will take 40 minutes to 1 hour to complete. It requires students to collect data from their classmates and use the data to do a regression analysis. The activity provides a statistical analysis website plus instructions for students to do regression analysis calculations. The materials students will need include a computer. Optional materials include a calculator. This activity can be provided on Google Classroom or printed as a physical copy for students to write on (preferred
Subjects:
Grades:
9th - 12th
Types:
CCSS:
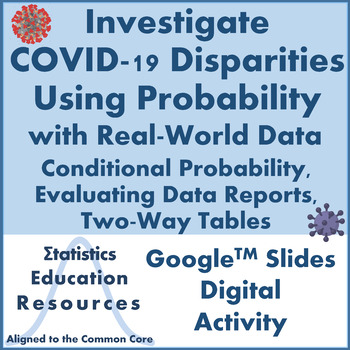
Investigate COVID-19 Disparities with Probability and Real Data
Distance Learning: Investigate COVID-19 Disparities Using Probability with Real-World Data (Common Core)If you have been observing the intersection of world events involving COVID-19 and racial justice and believe this to be an unmissable teachable moment, you are not alone. Finding ways to address these important topics in a STEM class can be challenging. However, given the extensive media coverage of these events, many of which include data, COVID-19 and racial justice are immediately relevant
Subjects:
Grades:
10th - 12th
Types:
CCSS:
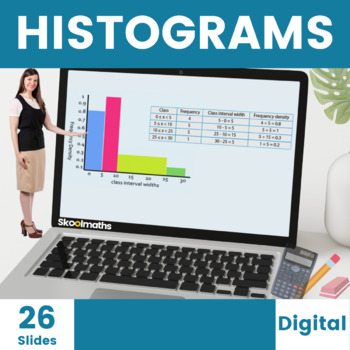
Histograms Digital Lesson for High School
Teach your High School students how to Interpret and Construct Histograms with unequal class intervals with these completely interactive digital home learning resources with engaging content and instant learner feedback. Buy this great value 26-page bundle of interactive histogram activities today to save you hours of planning and don't forget to leave an honest review if you download this worksheet for TPT credit :)Like this? You might also like...Conditional ProbabilityCalculating AveragesCond
Subjects:
Grades:
8th - 10th, Higher Education
CCSS:
Also included in: Complete Statistics and Probability Bundle | Digital and Print
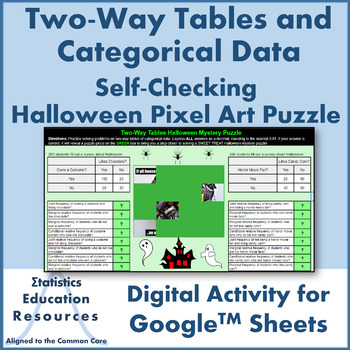
Two-Way Tables and Categorical Data Halloween Pixel Art Puzzle (Common Core)
This digital Halloween pixel art puzzle created in Google™ Sheets involves computing marginal, joint and conditional relative frequencies as well as marginal and joint frequencies from two-way tables. Students practice computing and interpreting frequencies and relative frequencies while solving a sweet Halloween puzzle. This fun twist on worksheets engages students by allowing them to independently solve a sweet Halloween puzzle as they reinforce statistics concepts. This activity can be assig
Subjects:
Grades:
8th - 11th
Types:
CCSS:
Showing 1-11 of 11 results

