8 results
8th grade graphing centers for SMART Notebook
Recognize Proportional Relationships
Common Core Standard 7.RP.2.a
Decide whether two quantities are in a proportional relationship, e.g., by testing for equivalent ratios in a table or graphing on a coordinate plane and observing whether the graph is a straight line through the origin.
Use the following Smart Board pages as a center, as an alternate teaching format for small groups or 1:1, or as formative or summative assessment.
You can also print and laminate the pages to use with dry erase markers for discrete t
Subjects:
Grades:
6th - 8th
CCSS:
Box and Whisker Plots Smartboard Slides Lesson Step by Step How to Constuct
Math Teachers ~ You'll LOVE this GREAT Smartboard-Slides-LESSON that teaches students step-by-step how to construct a Box-and-Whisker-Plot; Least/Greatest Value, Lower/Upper Quartile, Median, and how to Find the Interquartile and Range. 37 slides in all! Your students will LOVE this smartboard lesson. WARNING: You MUST have SMART Technologies SMART software, and a SMARTBOARD to teach from, to effectively download, open and use this Interactive Smartboard Lesson. Go to https://legacy.smarttech.co
Subjects:
Grades:
5th - 8th, Staff
Also included in: Box & Whisker Plots Smartboard Slides Notes Worksheet BUNDLE
Multiplying and Dividing Inequalities Smartboard Slides Lesson
Math Teachers ~ You'll LOVE this GREAT Multiply-and-Divide Inequalities-Smartboard-Slides-Lesson that reviews how to graph Inequalities and teaches how to solve multiplication-and-division-of-Inequalities. Your students will LOVE this lesson! You'll enjoy using it year after year! WARNING: You MUST have SMART Technologies SMART software, and a SMARTBOARD to teach from, to effectively download, open and use this Interactive Smartboard Lesson. Go to https://legacy.smarttech.com/en/products/educati
Subjects:
Grades:
5th - 8th, Staff
Solving and Graphing Inequalities Smartboard Slides Lesson
Math Teachers ~ you'll LOVE this Intro-to-Inequalities: Solving-&-Graphing Smartboard-Slides-Lesson that introduces Inequalities, and teaches students how to solve and graph them. You'll enjoy using this year after year!WARNING: You MUST have SMART Technologies SMART software, and a SMARTBOARD to teach from, to effectively download, open and use this Interactive Smartboard Lesson. Go to https://legacy.smarttech.com/en/products/education-software/smart-learning-suite/download/trial to downloa
Subjects:
Grades:
5th - 8th, Staff
Adding and Subtracting Inequalities Smartboard Slides Lesson
FABULOUS Smart board Slides-Lesson on Adding-and-Subtracting-Inequalities reviews graphing symbols for circles and arrows, along with step by step how to solve Inequalities. Also includes practice problems. GREAT resource you'll use year after year! WARNING: You MUST have SMART Technologies SMART software, and a SMARTBOARD to teach from, to effectively download, open and use this Interactive Smartboard Lesson. Go to https://legacy.smarttech.com/en/products/education-software/smart-learning-suit
Subjects:
Grades:
5th - 8th
Probability of Independent Events Using Sample Space Smartboard Slides Lesson
Probability-of-Independent-Events-Using-Sample-Space Smartboard-Lesson has lots of interactive practice for your students. 23 slides in all! Great graphics and problems! Your students will LOVE this lesson! You'll use it year after year! WARNING: You MUST have SMART Technologies SMART software, and a SMARTBOARD to teach from, to effectively download, open and use this Interactive Smartboard Lesson. Go to https://legacy.smarttech.com/en/products/education-software/smart-learning-suite/download/tr
Subjects:
Grades:
5th - 8th, Staff
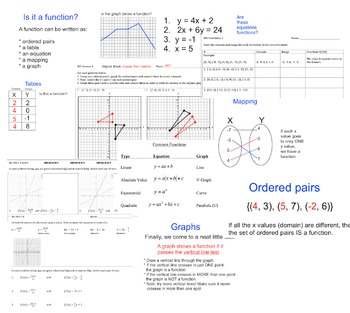
Complete presentation - Functions, inverses
This is a complete, 43 slide SMART Board presentation on functions. Teachers can walk though slide by slide, asking questions along the way to discover many different ways we can write and represent functions: ordered pairs, mapping, equations, graphing, etc.Teachers can print out activities on functions / inverses.1) Is it a function? Students look at domain and range to determine if sets of numbers are functions or not. Then they plot points to see if sets of ordered pairs pass the 'vertical l
Subjects:
Grades:
7th - 10th
One Variable inequalities and graphing
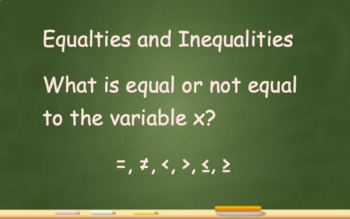
Smartboard lesson about one variable inequalities, x=1, x>2, x<4... What do they mean and how do we graph them. There are short lessons attached with interactive student lessons in between. I do, we do, you do is the format of this Smartboard lesson. Also, attached are two worksheets with the answers attached ideal for silent work or group work to test their understanding.
Subjects:
Grades:
6th - 9th
Showing 1-8 of 8 results


