66 results
8th grade graphing centers for Microsoft PowerPoint

SCIENCE STATIONS: GREENHOUSE EFFECT (Great for Observations!)
Learn all about the Greenhouse Effect with this in depth Station Activity. I have used these stations two ways: 1) As true stations where the students rotate. 2) Each station completed on a separate day. I use the coordinate graphing as an extra. Students bring it with them to every station and if they finish early they have something to do.
Station 1 - Informational Text - Read informational text about the Greenhouse Effect. Answer the questions that follow in complete sentences.
Sta
Subjects:
Grades:
5th - 10th
Types:
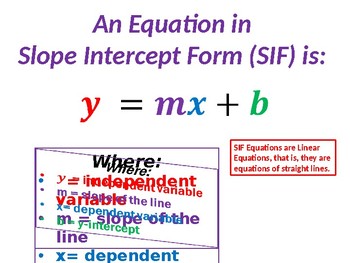
Introduction to Slope Intercept Form (SIF) of Equation including Graphing
This MS PowerPoint presentation provides an easy-to-understand and classroom-tested technique for understanding the Slope Intercept Form (SIF) of linear equation. I have used this presentation multiple times in my general 8th grade math classes and as a refresher in my Math 1/Algebra 1 classes. The solution summaries and techniques for 3 different example equations are provided. Each one is fully animated to help the students remember the important concepts and to remain focused while reviewi
Subjects:
Grades:
7th - 10th
CCSS:
Also included in: Math 1 / Algebra 1 Bundle - Unit 2 Linear Functions
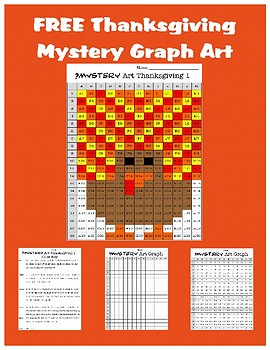
FREE Thanksgiving Mystery Graph Art
Thanksgiving Mystery Graph Art
Fun FREE Thanksgiving TURKEY graphing, math activity for students. Color key and 2 blank graphs are included.
TEN! different Thanksgiving Mystery Graph Art pictures are available in the Thanksgiving Mystery Graph Art Collection for only 3.99!
Follow me by clicking on the green star next to my store name for other freebies and collections :) and please check out my other items on Teachers Pay Teachers, including additional Mystery Graph Art Collections, Classro
Subjects:
Grades:
2nd - 8th
Types:
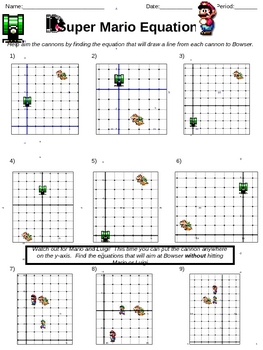
Graphing Linear Equations - Super Linear Equations
This worksheet is intended for use after students have learned the basics of writing equations in slope-intercept form.
Students will:
1) Write an equation for a line with a given point and y-intercept.
2) Write an equation for a line passing through a given point with no set y-intercept
3) Estimate the slope of a line when given no grid lines on a graph.
This PowerPoint file is intended to be printed as a worksheet rather than as a presentation.
Subjects:
Grades:
7th - 9th
Types:
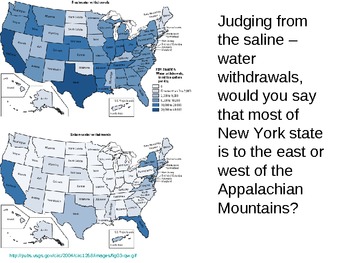
graphing bellwork for jr. high
This is a PowerPoint with a separate slide for each day of school. There is a graph that stays consistant for the entire week. One new question is presented regarding the specific graph. I created this presentation to be used as bellwork for jr. high students, including special education students. The questions are designed to help meet the weaknesses in univariante data shown by our MEAP scores. Answers are located in the notes part of the presentation, so you can print off an answer key.s
Subjects:
Grades:
6th - 9th
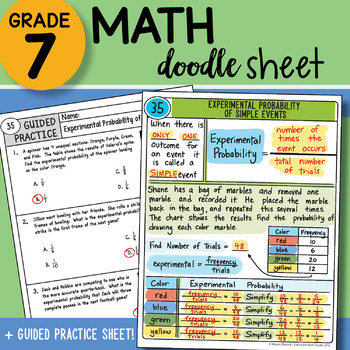
Math Doodle Sheet - Experimental Probability of Simple Events - Notes with PPT
7th Grade Math Doodle Sheet Product INCLUDES:Math Doodle Sheet - blank and keyGuided Practice Sheet - blank and keyPowerPoint – to show students the KEY– two versions of both sheets included: INB and large 8.5 x 11 size ALL TEKS Aligned– plan for the FULL year included with table of contents page for INB! SAVE BIG and buy the WHOLE YEAR SET found here:7th Grade Math Doodle Sheets ALL YEAR SET WHOLE YEAR SET List below:ALL TEKS Aligned– plan for the FULL year included! LIST of 88 Doodle Sheets p
Subjects:
Grades:
6th - 8th
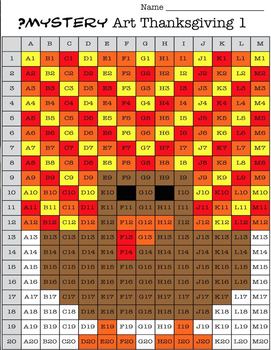
Collection of TEN Thanksgiving Mystery Graph Art Worksheets
Thanksgiving Mystery Graph Art Set
TEN! different Thanksgiving Mystery Graph Art pictures are available in the Thanksgiving Mystery Graph Art Collection for only 3.99!
Follow me by clicking on the green star next to my store name for freebies and awesome collections :) and please check out my other items on Teachers Pay Teachers, including additional Mystery Graph Art Collections, Classroom Economy Pack, Color By Number, Certificates and more!
Subjects:
Grades:
2nd - 8th
Types:
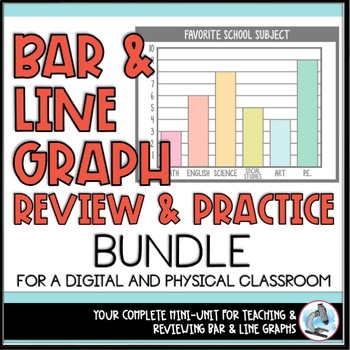
Teaching Bar and Line Graph Basics Bundle
Making bar and line graphs shouldn't be difficult, especially for students at a middle school level. But I'd bet if you've ever asked your students to make a simple bar or line graph from a data table, you got a very wide range of graphs. Some graphs looked great, but others didn't even look like graphs. Say goodbye to those days forever with this bundle! Created specifically for middle school teachers who need to reinforce and review basic bar and line graphs, this resource has everything to ge
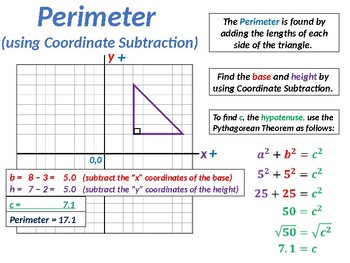
Perimeter and Area in the Coordinate Plane Summay
I use this MS PowerPoint presentation file in my 8th grade Pre-Algebra and 9th grade Math I classes to initiate our study of the methods that can be used to calculate the perimeter and area of 2-D shapes in the coordinate plane. It includes the review of 2 methods I use to compute the side lengths of various shapes (triangles, rectangles, etc.) on a graph grid. It is a totally animated ppt file and is easy for students to understand the concepts. Any of the ppt animations can be modified as d
Grades:
8th - 10th
CCSS:
Also included in: Math 1 / Algebra 1 Bundle - Unit 10 Connecting Algebra and Geometry
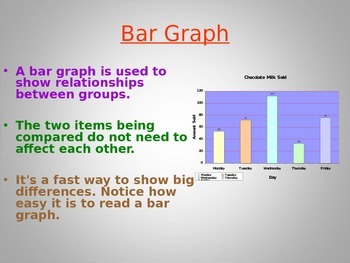
Types of Graphs 1
This is an interactive review and intro lesson to various types of graphs and displaying data.
Students are provided with visual examples, definitions and steps on how to read various graphs and to understand what information the graph is displaying. Types of trends of data is also discussed and follow up homework asking students to find a graph for the next day.
Grades:
6th - 8th
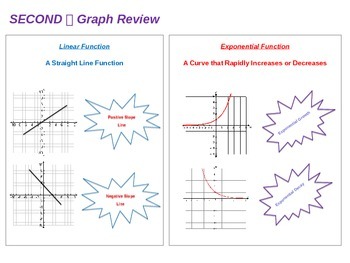
Comparing Linear and Exponential Functions (Equation, Table and Graph)
This PowerPoint (ppt) presentation reviews the methods and steps that students can use to determine whether a function represents a linear or exponential relationship. I use this ppt in my Math I (Algebra I) classes immediately after I cover the units on linear and exponential functions, thus, it is classroom tested. It is a fully animated ppt presentation and also includes five (5) tables at the end for the students to complete on their copy of the slides as the teacher goes through the prese
Subjects:
Grades:
8th - 10th
CCSS:
Also included in: Math 1 / Algebra 1 Bundle - Unit 8 General Functions

Linear Functions Stations Activity
Need an activity to help your students practice working with linear functions? Well, have I got the perfect thing for you!This is a stations activity that covers different topics within linear functions, such as:Solving Literal EquationsWriting Equations Given Points, Tables, or Verbal DescriptionsGraphing Linear FunctionsCalculating Slope/Rate of ChangeEvaluating Functions (for x and for f(x))This activity includes 12 problems. Station numbers have been left blank so you can mix the problems up
Grades:
8th - 9th
Types:
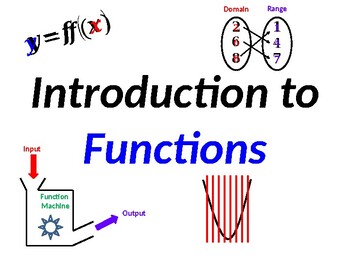
Introduction to Functions
This MS PPT presentation provides a very detailed and comprehensive introduction to functions and includes the following Table of Contents:BackgroundVocabularyDomain and RangeFunction Evaluation Criteria (using Coordinate Lists, Mapping Diagrams and Vertical Line Test)The presentation package includes significant critical background information on functions as well as the vocabulary that is encountered in the study of functions. It also includes a detailed algebraic and graphical description an
Subjects:
Grades:
8th - 12th
CCSS:
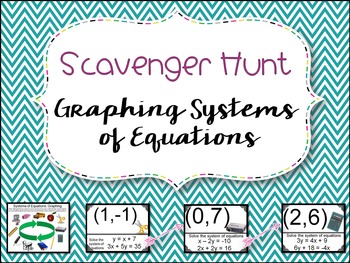
Graphing Systems of Equations Scavenger Hunt
This Scavenger Hunt contains questions to allow students to solve systems of equations by graphing them. Other methods can be used, but these questions were designed to be work on graphs that go from -10 to +10.
--------
What is a Scavenger Hunt?
A scavenger hunt is a more engaging and mobile alternative to just giving the students a worksheet.
To use the scavenger hunt:
1) The slides are currently in order so that the question on the bottom half of each slide is answered on the top half of
Grades:
6th - 8th
Types:
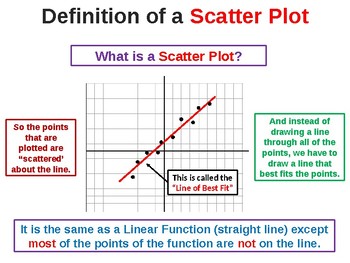
Scatterplots and Correlation Summary
This MS PowerPoint presentation covers the specifics of both Scatterplots and Correlation. It is used to kickoff our study of these topics in my Pre-Algebra and Math I classes. It covers the detailed steps to follow to analyze a data set and construct a Scatterplot and Line of Best Fit as well as determine the Correlation of the data. It covers the steps to use with to determine these measures without a graphing calculator. It is a totally animated ppt file and very easy for students to unde
Subjects:
Grades:
8th - 10th
CCSS:
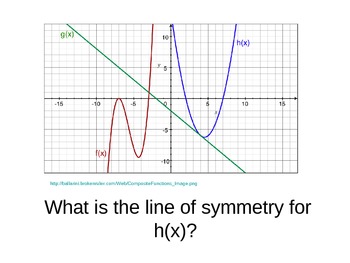
Graphing Bellwork for Math and Science
These are a series of graphs, maps, charts on PowerPoint slides. Each slide has the graphic and a question. Each graphic is used five times (five questions). Most of the questions can be answered fairly quickly so these can be used for bellwork/seatwork for those first or last five minutes of class. They can be either answered by the individual students or discussed as a class as a whole. The answers are located in the notes section of the presentation, so you can print off an answer key for
Subjects:
Grades:
8th - 12th
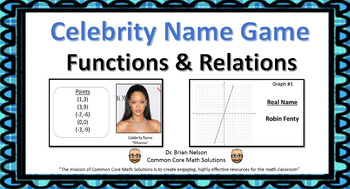
Functions & Relations - Celebrity Name Matching Game!
This is a functions & relations activity. This activity has always been a hit in my classroom and I am sure it will be the same in yours! Students must match math relations and their linear graphs . Each match will reveal the real life name of a popular celebrity.
An answer key is provided
Subjects:
Grades:
8th - 10th
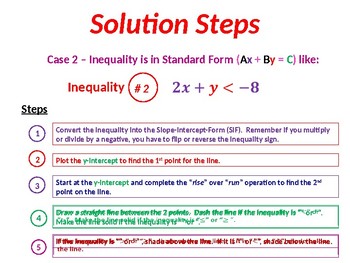
Solving Systems of Linear Inequalities by Graphing Solution Summary
The attached MS PowerPoint slideshow describes in detail the steps I use to solve a system of linear inequalities by graphing. It specifies the graphing steps to use for inequalities in both slope-intercept form and standard form to ultimately determine the common solution area for the system of inequalities. This presentation is classroom-tested in my Math 1 classes. It can be used in any grade level and given the animations contained in the ppt presentation, it is easy for separate setting/
Grades:
8th - 10th
CCSS:
Also included in: Math 1 / Algebra 1 Bundle - Unit 3 Systems of Equations & Inequalities
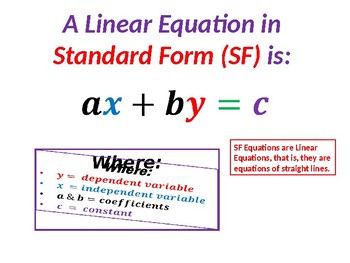
Introduction to Graphing Linear Equations in Standard Form (ax + by = c)
This MS PowerPoint presentation provides an easy-to-understand and classroom-tested technique for graphing linear equations in standard form (ax+by=c). I have used this presentation multiple times in my general 8th grade math classes and as a refresher in my Math 1/Algebra 1 classes. The graphing solution summaries and techniques for 3 different example equations are provided. Each one is fully animated to help the students remember the important concepts and to remain focused while reviewing
Grades:
8th - 10th
Also included in: Math 1 / Algebra 1 Bundle - Unit 2 Linear Functions
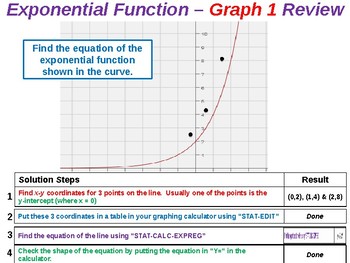
Exponential Functions/Equations Solution Summary
This MS PowerPoint presentation provides a comprehensive and easy-to-understand solution technique for determining exponential functions/equations given a graph or a table of values. The presentation includes the detailed, step-by-step techniques students can use to determine exponential functions/equations with and without a graphing calculator. 4 example graphs and 2 tables are used to illustrate the solution steps. The slidepack is fully animated and can be modified as desired by the teach
Grades:
8th - 10th
CCSS:
Also included in: Math 3 / Algebra 2 Bundle - Unit 4 Exponential Functions
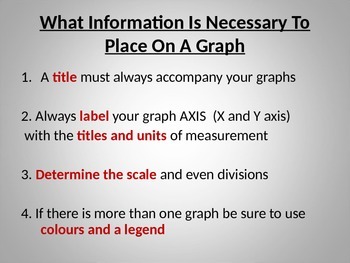
Review On How To Graph
This powerpoint reviews the concept of graphing and the X and Y axis. Using a global approach, students work in groups to graph precipitation and climate for Toronto and compare it to the graph provided on Mumbai.
This powerpoint can be used in grades 6-8 when reviewing the x and y axis as well as double bar graphs, line graphs and determining the scale of graphs.
Grades:
6th - 8th
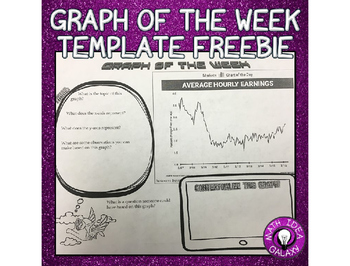
Graph of the Week Template
This resource walks students through analyzing a graph. It helps develop critical thinking, a deeper understanding of graphs, and integrate writing in math class. To use, simply add a graph, then print and go.
This template is designed to use when implementing the Graph of the Week. This approach gets students thinking critically about graphs, and what they represent. Students will interpret what the x-axis and y-axis represent, identify trends, and make predictions.
Read more about how to us
Grades:
7th - 9th
Types:
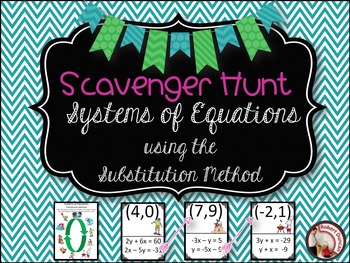
Solving System of Equations using the Substitution Method
This Scavenger Hunt contains questions designed to give students practice solving systems of equations using the Substitution Method.
--------
What is a Scavenger Hunt?
A scavenger hunt is a more engaging and mobile alternative to just giving the students a worksheet.
To use the scavenger hunt:
1) The slides are currently in order so that the question on the bottom half of each slide is answered on the top half of the next slide.
2) Print out all the slides and post them up randomly around t
Subjects:
Grades:
8th - 10th
Types:

Solving Linear Inequalities in 1 Variable Solution Summary
The attached MS PowerPoint slideshow describes in detail the steps I use to solve and graph a linear inequality with 1 variable. It specifies the specific steps to use for inequalities that have 1 variable. This presentation is classroom-tested in my Math 1 classes. It can be used in any grade level and given the animations contained in the ppt presentation, it is easy for separate setting/co-taught EC students to understand. This ppt presentation is fully animated to keep the students engag
Subjects:
Grades:
8th - 10th
CCSS:
Also included in: Math 1 / Algebra 1 Bundle - Unit 2 Linear Functions
Showing 1-24 of 66 results


