21 results
Free high school algebra activities for Microsoft Excel

BINGO Function Notation Bingo
Use this file to create a BINGO set for practicing function notation. The students are given four functions and then the fun starts. The functions are simple linear functions with positive values only. You have to supply a set of 3x5 index cards.
Grades:
7th - 9th
Types:
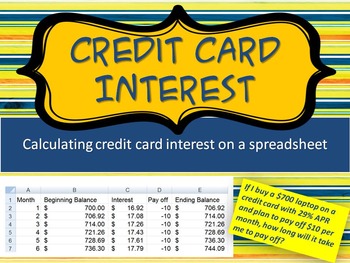
Credit Card Interest: Calculating Interest on a Spreadsheet
This activity is designed for the spreadsheet-proficient teacher to engage students in a discussion of how credit card interest can build upon itself. It is appropriate for a Pre-Algebra class learning about simple interest or compound interest. It can be done with the teacher operating the spreadsheet, or students with their own devices can learn the skill of building and manipulating a spreadsheet. Included is a two-sided student handout and answer key, both provided as an editable Word doc
Grades:
6th - 9th
Types:

Thanksgiving Pixel Art - Solving Equations
Perfect activity for Thanksgiving!
Subjects:
Grades:
7th - 12th
Types:
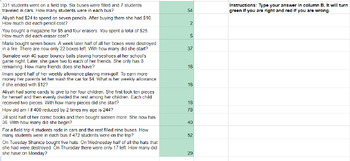
Two Step Equations Word Problems Color Changing Spreadsheet
This is a spreadsheet with 11 two step equations word problems. Students will type in their answers in column B. If they are correct, the box will turn green. If they are incorrect, the box will turn red. (Delete the answers before assigning to students)
Grades:
8th - 9th
Types:

Systems of Equations (substitution) Pixel Art
Students solve 7 systems of equations using substitution. Correct answers will slowly color in a picture of an ogre with a stick. Incorrect will be bold and red and will not color in the pixel art.Key is included.
Grades:
7th - 9th
Types:
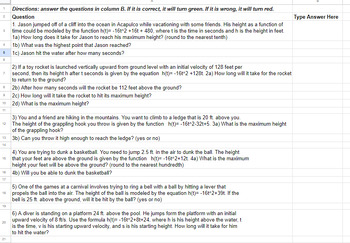
Quadratic Word Problems Color Changing Google Sheets
6 detailed applications of quadratics word problems including maximums, roots, and y-intercepts. Determine the maximum heights of objects, or when they hit the ground. Excel Sheet changes to green if students type in the correct answer and turns red if they type in the wrong answer.
Grades:
9th
Types:
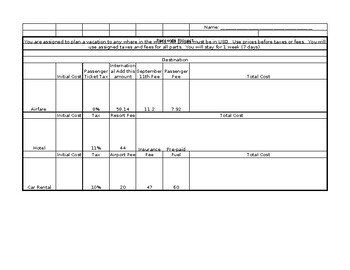
Travel Percent Project
Project for Practicing Taxes and Fees from Travel. Includes 3 parts on price markup.
Subjects:
Grades:
5th - 9th
Types:
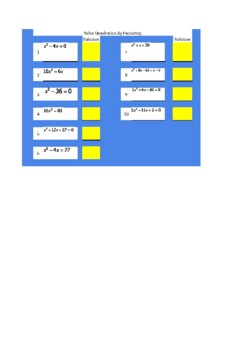
Solve Quadratics by Factoring (Color-Changing/Self-Grading Spreadsheet)
Factoring methods needed:-Factoring with GCF-Factoring trinomials when a=1-Factoring trinomials when a<1 or a>1-Factoring differences of perfect squares
Subjects:
Grades:
8th - 12th
Types:
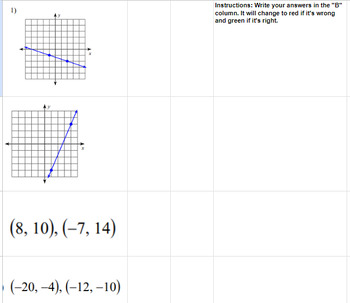
Color Changing Slope Review Quick Check
8 problem quick review finding slope from a graph, two points, table, and equations. This is a google sheets assignment that changes color to green if students type in the correct answer and red if they type in the wrong one.
Grades:
8th - 9th
Types:
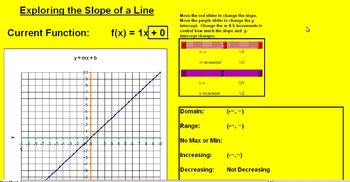
Linear Functions Exploration Excel Spreadsheet
If you're looking for a way for students to discover linear functions in an interactive way, this is the spreadsheet you're looking for. Students will be able to discover the slope, x and y intercepts, and so much more, As the slope and y-intercepts change, so does the graph. Microsoft Excel 2002 and above is required. Make sure you enable macros.
Linear Functions Exploration by Montario Fletcher is licensed under a Creative Commons Attribution-NonCommercial-NoDerivs 3.0 Unported License.
Subjects:
Grades:
6th - 10th
Types:
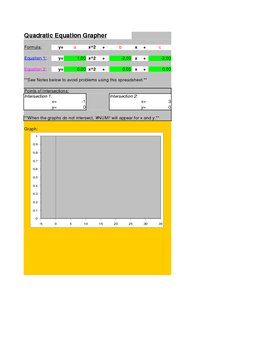
Quadratic Grapher
Quadratic Grapher MS Excel Spreadsheet graphs up to 2 quadratic equations / functions at a time. It is color coded so it is easy to see which parabola corresponds to which equation.
It also displays 10 points. The x values can be changed to your liking.
It also finds the points of intersection between the two parabolas. This is useful for solving a system of two quadratic equations. It could probably even solve a system of two equations that has one quadratic and linear equation. Just inp
Grades:
9th - 12th, Higher Education
Types:
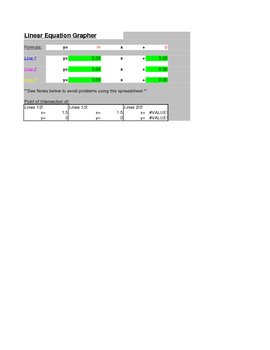
Linear Grapher
Linear Grapher Microsoft Excel Spreadsheet that allows you to graph up to 3 lines at a time. The lines are color coded with the equations, so you will know which line corresponds to which equation.
It also displays 10 points for each equation. The x values for these points can be adjusted.
It also finds the points of intersection for every pair of lines. This is helpful for system of equations.
It also has a seperate application built into the spreadsheet for finding the equation of a line
Grades:
8th - 12th, Higher Education
Types:
MATH LESSON & MATH LAB - Wind Chill Factor
Most people have heard of the wind chill factor but few people know that there is an actual formula used to calculate it! This is a tried and true math lesson and lab that I have created and used for many years with my 7th and 8th grade classes. Students get a "kick" out of learning about the actual formula used by the National Weather Service to calculate the wind chill factor. They learn some history about the wind chill factor, analyze the formula used, gain an understanding of how wind spee
Subjects:
Grades:
5th - 10th, Adult Education
Types:
NGSS:
MS-ESS3-2
, MS-LS2-2
, MS-ESS2-5
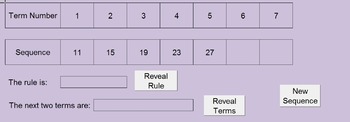
Linear Sequences Free - Randomly Generated Interactive Excel Worksheets
*Update* I have now solved the difficulties with the compatibility between Excel 2007 and Excel 2013. I apologise for any problems anyone has experienced.
This Excel workbook uses random generation to allow you to produce as many new examples as your class requires. Macro buttons allow you to choose the order in which to reveal the answers and give greater flexibility to your teaching. The workbook works best with mini whiteboards/show me boards to encourage whole class involvement.
Sheet 1 -
Grades:
6th - 9th

Excel Analyzing Data Project
Students will select a set of data and use excel to create a chart, find mean, median, and mode and other relevant information regarding their data.
Subjects:
Grades:
8th - 9th
Types:
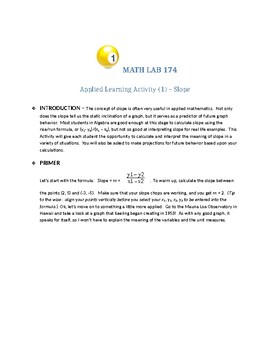
Slope and Application (Math Lab 1)
MATH LAB 1:
1 hour exploration of SLOPE integrating real world application, internet research, APA citation, and technology usage - Excel graphing of researched (x,y) data
Grades:
7th - 12th
Types:
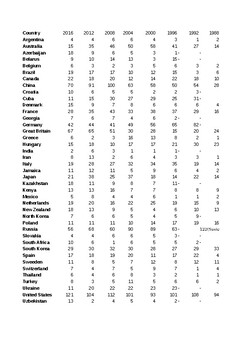
Olympic Medal Data for "Predicting Tokyo Olympics" Activity
This data is used for this product: Predicting Tokyo Olympics
Subjects:
Grades:
8th - 10th
Types:
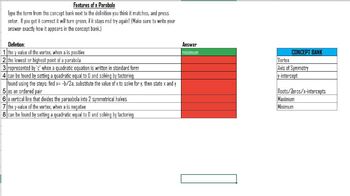
Self-Checking Parabola Vocabulary Activity/Assessment Distance/Online Learning
Review Features of a Parabola Vocabulary, including, vertex, axis of symmetry, minimum/maximum, y-intercept, and zeros/roots/x-intercepts. Self-checking with color coding boxes.
Subjects:
Grades:
7th - 12th
Types:

Row Races Activity
There are four different races. All solving one-step equations. Two are adding and subtracting, and two are multiplying and dividing.
Students should sit in rows. One student answers the first problem and passes it back to the next. the pattern continues.
Grades:
6th - 9th
Types:
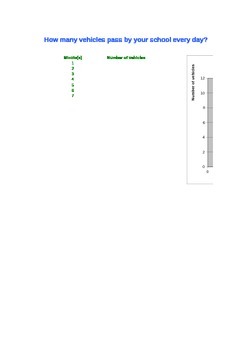
How many vehicles pass by your school every day? XLS Graph creator
This is an excel file that generate the graph for activity
"How many vehicles pass by your school every day?"
Also download the activity that goes along with this file
http://www.teacherspayteachers.com/Product/How-many-vehicles-pass-by-your-school-every-day-1659552
Subjects:
Grades:
6th - 12th
Types:
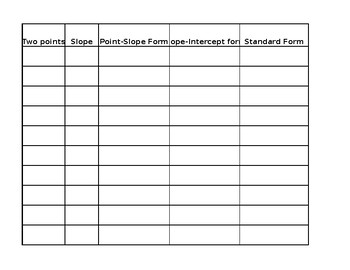
Forms of a line sort
Given 2 points, find the equation of a line in point-slope form, slope-intercept form, and standard form. Student page is randomized so you don't have to worry about kids gluing a whole strip in place. You can give a completely blank answer grid or for ease of grading have the points in a fixed place. I like to have the answer grid in white and the cut pieces in a color. Have the students cut out the slope and different forms of the linear equations and glue them into the matching spots.
Subjects:
Grades:
8th - 10th
Types:
Showing 1-21 of 21 results


