499 results
8th grade statistics interactive notebooks for products for TpT sellers
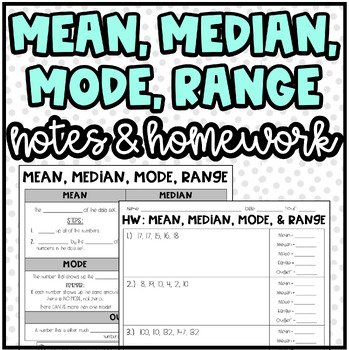
Mean, Median, Mode, Range, and Outlier | Notes and Homework or Practice
Notes & Homework: Mean, Median, Mode, Range, and Outlier:I used these notes, practice, and homework with my students. I used this lesson to serve as a "quick lesson" for the students. It covers how to find the mean, median, mode, range, and outlier.Product Includes:Notes Page with 2 examplesNotes Page Answer KeyHomework (10 organized problems with workspace provided)Homework Answer KeyThank You! ❤️I really appreciate your interest in my product! I love to create new things for my students! A
Subjects:
Grades:
5th - 8th
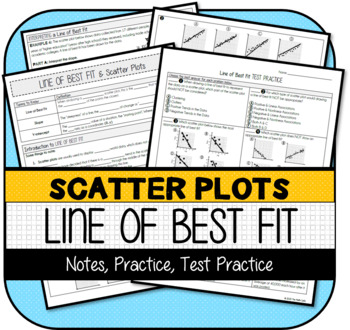
Scatter Plots: Line of Best Fit NOTES & PRACTICE
This resource contains the following items:1) Introduction to Line of Best Fit NOTES & PRACTICE2) Interpreting Line of Best Fit NOTES & PRACTICE3) Line of Best Fit TEST PRACTICE --8 Multiple Choice Questions --Printable --Version for Google Forms (auto-graded)4) Answer Keys to All PartsThis resource was developed to meet the requirements of the 8th Grade Statistics & Probability standards below:CCSS.MATH.CONTENT.8.SP.A.2 Know that straight lines are widely used to model
Subjects:
Grades:
7th - 9th
Also included in: Scatter Plots MINI-BUNDLE
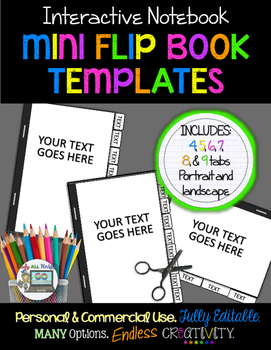
Mini Flip Book Templates for Interactive Notebooks Personal and Commercial Use
Mini Flip Book Templates for Interactive Notebooks Personal and Commercial Use
Includes:
★Mini flip book templates (there are 12)
4 tabs
5 tabs
6 tabs
7 tabs
8 tabs
9 tabs
★The mini flip book templates come in portrait, and landscape.
★I’ve been using these original templates over and over since 2014.
★Fully editable files- the files are in Power Point.
★Directions on how to use the mini flip books in a classroom
★Commercial and personal use permitted. Please give me credit in your commercia
Grades:
PreK - 12th, Higher Education, Adult Education, Staff
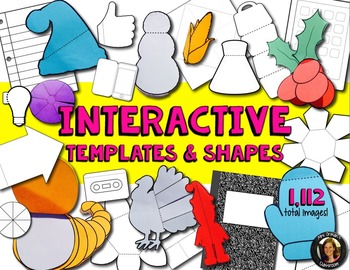
Interactive Notebook Templates & Shapes Bundle {Commercial Use Allowed}
Interactive Notebook, Lap book, Flip book Templates and Clip Art Shapes ~ HUGE Bundle of 1,000 Images! {Commercial Use Allowed}
NEWLY UPDATED with editable templates and an additional 350+ images, including Fall, Halloween, Thanksgiving, Christmas, and Winter themed shapes, flaps, and foldables! As I add to this growing bundle, the price is likely to increase. Buy now to get the best possible price.
Easily create interactive notebook, flip book, and lap book foldables for your students (or yo
Grades:
1st - 12th, Staff
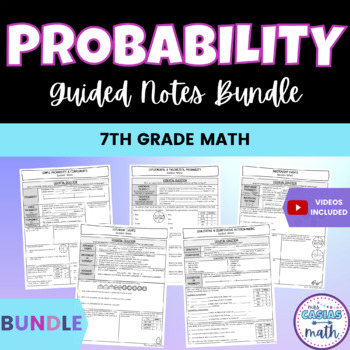
Probability 7th Grade Math Guided Notes Lessons BUNDLE
This bundle includes 8 concise, to the point and no-prep probability lessons. These notes are a great way to teach & introduce: Simple probability and complementsIndependent and dependent events Simulations and predictionsRandom samplingTheoretical and experimental probabilityThese notes are scaffolded and broken down well so that students develop a strong foundation before moving into trickier topics. Students and teachers love how easy these notes are to follow and understand. This bundle
Subjects:
Grades:
7th - 8th

Interactive Notebook Templates: Mini Books {Commercial Use Allowed}
Interactive Notebook Templates: Mini Books {Commercial Use Allowed}
Easily create interactive notebook mini-books with these templates. Includes templates for 3-tab, 5-tab, 6-tab, and 7-tab books. The images are already placed in Microsoft PowerPoint with text boxes over the text fields, so you can customize your books without having to do layout/design or any editing. (Though, you are still allowed to manipulate the images, so if you like layout and design, you have full reign.) Includes sever
Grades:
PreK - 12th, Higher Education, Staff
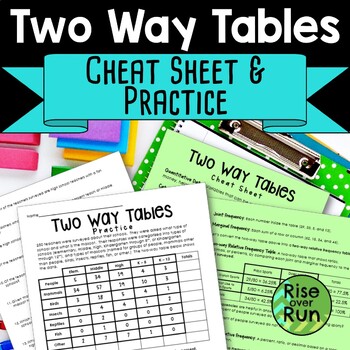
Two Way Frequency Tables Guided Notes and Practice Worksheet
Need an engaging way to get students learning about two way tables and bivariate data? This set of fill-in cheat sheets and practice helps students make sense of data and statistics represent in 2 way frequency tables. This set includes:Two Way Tables Cheat Sheets (2 Pages)These handouts have blanks to fill in with important vocabulary terms and examples of two way frequency tables. Questions are included too. This works great to fill out as a class to give students a solid foundation to und
Subjects:
Grades:
8th - 9th
CCSS:
Also included in: 8th Grade Math Activities & Lessons Bundle for the Whole Year
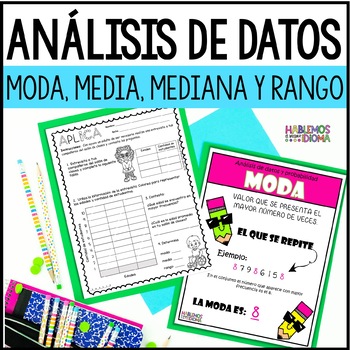
Análisis de datos moda, media, mediana y rango | Interpretación gráficas
¿Necesitas actividades para trabajar con tus estudiantes de grados primarios el análisis de datos (moda, media, mediana y rango) e interpretación de gráficas de una forma sencilla y divertida? Este recurso incluye carteles, hojas de trabajo, plegables para libreta interactiva y más.El siguiente recurso se llevó a cabo con la intención de ofrecer acceso curricular a la destreza de una forma sencilla y atractiva para el estudiante. El recurso se desarrolló para un aula inclusiva está dirigido a
Subjects:
Grades:
4th - 8th
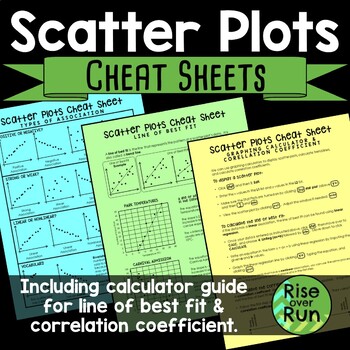
Scatter Plot Cheat Sheets Printable Guided Notes
Detailed sheets for the following topics: •Types of Association & VocabularyThis page shows examples of positive, negative, strong, weak, linear, and nonlinear association. It also shows clusters and outliers.•Line of Best FitThis page explains what a line of best is (or trend line) along with examples and nonexamples. It has 2 real world connections and how to interpret the line of best fit.•Graphing Calculator Guide & Correlation CoefficientThis sheet gives step by step instructions fo
Subjects:
Grades:
8th - 9th
CCSS:
Also included in: 8th Grade Math Activities & Lessons Bundle for the Whole Year
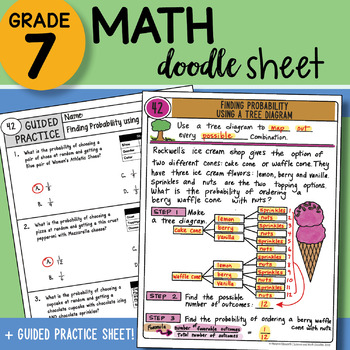
Math Doodle - Finding Probability using a Tree Diagram - Easy to Use Notes w PPT
7th Grade Math Doodle Sheet Product INCLUDES:Math Doodle Sheet - blank and keyGuided Practice Sheet - blank and keyPowerPoint – to show students the KEY– two versions of both sheets included: INB and large 8.5 x 11 size ALL TEKS Aligned– plan for the FULL year included with table of contents page for INB! SAVE BIG and buy the WHOLE YEAR SET found here:7th Grade Math Doodle Sheets ALL YEAR SET WHOLE YEAR SET List below:ALL TEKS Aligned– plan for the FULL year included! LIST of 88 Doodle Sheets p
Subjects:
Grades:
6th - 8th
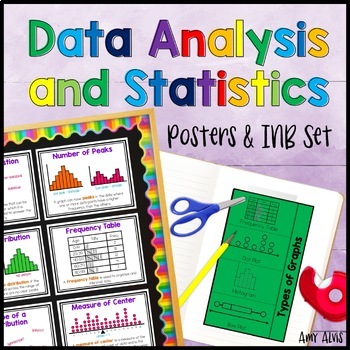
Data Analysis and Statistics Posters and Interactive Notebook INB Set
This poster (anchor chart) and interactive notebook (INB) set covers statistical questions, numerical data, categorical data, frequency table, dot plot, histogram, box and whisker plot, box plot, parts of a box and whisker plot, parts or a box plot, measure of center, spread, shape of distribution, symmetry, number of peaks, skewness, uniform distribution, outlier and gaps. The INB pages cover Types of Graphs, Statistical Questions and Patterns in Data.It includes 3 different interactive foldabl
Subjects:
Grades:
6th - 8th
Also included in: 6th Grade Posters and Interactive Notebook INB BUNDLE Anchor Chart
Two Way Frequency Tables and Relative Frequency Notes
NEW AND UPDATED FORMAT*
After careful study I am reformatting my notes to be easier to understand and be better resources for students. They will also more directly address the Common Core standards, and more specifically the Math Florida Standards (my home state).
I have designed this listing to directly address the listed standard for 8th grade, but it could be used in any grade covering frequency tables and relative frequency.
This PDF document contains:
1. Guided, two-column notes format
Subjects:
Grades:
8th - 10th
CCSS:
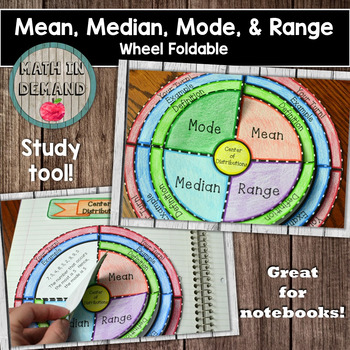
Mean, Median, Mode, and Range Wheel Foldable (Center of Distributions)
Students will construct a foldable on mean, median, mode, and range. There are 4 layers for the foldable: (1) Title, (2) Definition, (3) Example, and (4) Your Turn!. There is also a blank template included.
CLICK HERE to see my math foldables bundle!
CLICK HERE TO CHECK OUT MY VIDEO ON THIS FOLDABLE!
Subjects:
Grades:
5th - 9th
Also included in: Math Foldables Bundle (Includes All Math Wheel Foldables)
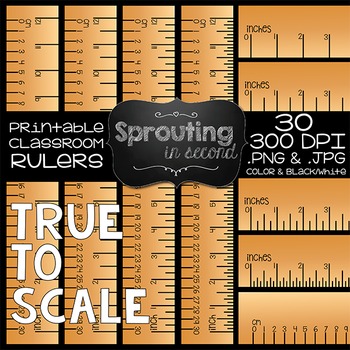
Ruler Clipart {Inches & Centimeters}
Ruler
Rulers - Measurement
***Updated 6/27/15***This set includes 30 files: 20 rulers as high quality 300 DPI .png images, and 10 rulers as high quality 300 DPI .jpg files which are TRUE TO SCALE. MUST USE MICROSOFT POWERPOINT FOR TRUE-TO-SCALE PRINTING
***THE PRINTABLE RULERS ARE ANGLED DIAGONALLY TO FIT 8.5"X11" PAPER - FOR END-USER PRINTING PRACTICALITY. CUT-OUT .JPG FILES FOR TRUE-TO-SCALE CLASSROOM USE. ROTATE/RESIZE .PNG IMAGES WHEN USING AS CLIPART.***
Rulers are:
inch
half-inch
quar
Grades:
K - 12th, Adult Education
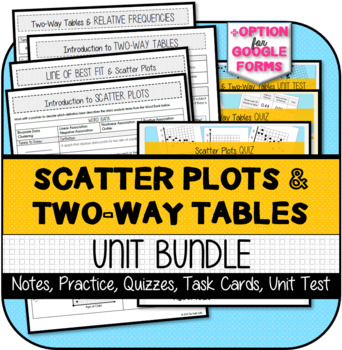
Scatter Plots & Two-Way Tables UNIT BUNDLE
This bundle contains:1) Notes with Practice Problems2) Test Practice 3) Supplementary Activities4) Quizzes (with options for Google Forms)5) Review Task Cards 6) Unit Test (with option for Google Forms)This resource was developed to meet the requirements of the 8th Grade Statistics & Probability Standards below:CCSS.MATH.CONTENT.8.SP.A.1 Construct and interpret scatter plots for bivariate measurement data to investigate patterns of association between two quantities. Describe patterns such a
Subjects:
Grades:
7th - 9th
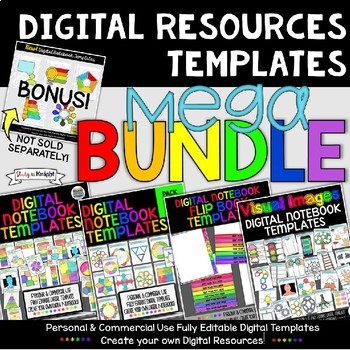
Digital Resources Templates Mega Bundle for Personal and Commercial Use
Digital Resources Templates Bundle for Personal and Commercial Use Great for creating digital resources, digital notebooks, paperless classroom resources, resources compatible with Google Drive™, digital interactive notebooks. Priced to save money if you buy them all together. I included a special bonus pack not sold separately. Totally a time saver!
Includes:
DIGITAL NOTEBOOK TEMPLATES FOR PAPERLESS CLASSROOMS AND GOOGLE DRIVE
DIGITAL NOTEBOOK PAPERLESS TEMPLATES PERSONAL AND COMMERCIAL USE {
Grades:
PreK - 12th, Higher Education, Adult Education, Staff
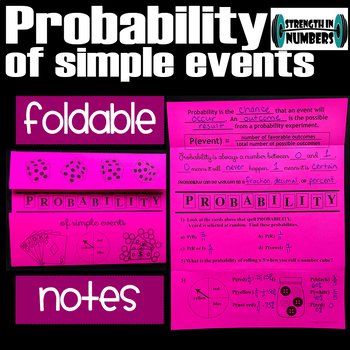
Simple Probability Foldable Notes for Interactive Notebook
Students love foldables for notes! This one covers the probability of simple events. These fit perfectly in a composition book for interactive notebooks or can be used on its own. Key included.Don't forget to earn TPT credits towards FREE products when you leave feedback! :)Try a FREE paper chain here!Try a FREE puzzle here!Check out my other PAPER CHAINS:One and Two Step InequalitiesEaster – Solving ProportionsBasketball - SlopeEaster Peeps – Order of OperationsArea and PerimeterBeach – Seven
Subjects:
Grades:
6th - 10th
Also included in: Complete BUNDLE of 50 Foldable Notes for Math 7
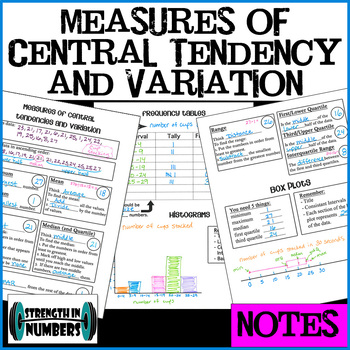
Interactive Notebook NOTES: Mean Median Mode Range Quartiles Box Plot Histogram
This set contains suggestions for student data collection and notes that use the data for measures of central tendencies and variation (mean, median, mode, range, first and third, quartiles, interquartile range, outliers), box plots, frequency tables, and histograms! Sounds like so much but these topics all go together so well. And by using data collected by students ABOUT students, they will be much more interested. This product contains ideas for collecting data, three full size (8.5x11) pa
Subjects:
Grades:
6th - 9th
Also included in: Complete BUNDLE of 50 Foldable Notes for Math 7
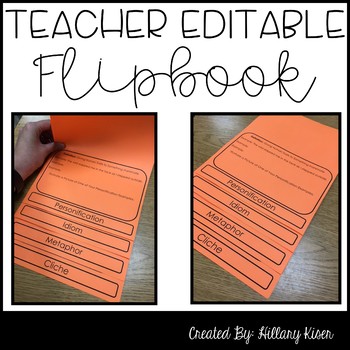
Editable Flipbook *FOR COMMERCIAL USE*
Finally! Here you have it! a foldable flipbook that is completely editable, and for commercieal use in your store!
When you download this product, you will be getting a 4-flap, 6-flap, and 8-flap flipbook. Already measured out and ready to print. All you have to do is add your text.
NOTE: There is red text on EACH slide...this is so you will know what information to type on each slide. DELETE the red information BEFORE printing!
NOTE: READ INSTRUCTIONS BEFORE PRINTING! Instructions are incl
Grades:
PreK - 12th, Higher Education, Adult Education, Staff
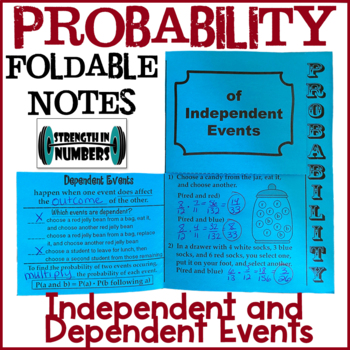
Probability Independent and Dependent Events Foldable Notes Interactive Notebook
Students love foldables for notes! This one covers the probability of independent and dependent events. Includes definitions, formulas, determining if events are dependent or independent and sample probability problems. Some of the practice problems are the same so you can talk with your students about how/why the answers are different when the events are dependent on each other. These fit perfectly in a composition book for interactive notebooks or can be used on its own. Key included.Don
Subjects:
Grades:
6th - 10th
Also included in: Complete BUNDLE of 50 Foldable Notes for Math 7
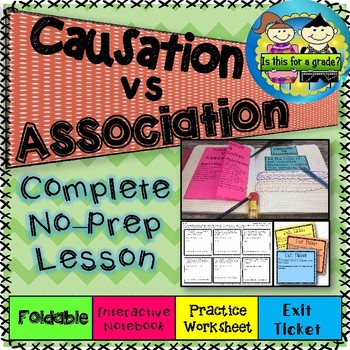
Causation vs Association (Correlation) Foldable, Activity, Practice, & Exit
Complete lesson, start to finish at your finger tips. The lesson introduces differentiating between causation vs association. The foldable is a great guided practice, the interactive notebook is a great way for students to collaborate and create and manipulate, the practice sheet can be used to reinforce, and I find exit tickets KEY to the assessment process. It allows me to see who has it and common misconceptions that I need to fix. What's Included:Foldable NotesInteractive Notebook ActivityPr
Subjects:
Grades:
8th - 12th
CCSS:
Also included in: Linear Functions Mega Bundle: No Prep Foldable Lessons
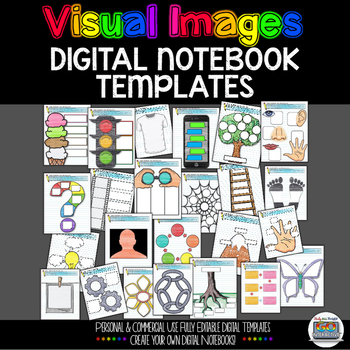
Digital Interactive Notebook Visual Images Templates Personal and Commercial Use
Digital Interactive Notebook Visual Images Templates for Personal and Commercial Use
Great for creating visual images digital interactive notebooks. Totally a time saver!
Includes:
★Includes all for you to use for personal or commercial use
★Fully editable visual images digital interactive notebook templates you can use over and over again in your own products and get inspiration to make your own.
Please give credit in your commercial product for the Digital Interactive Notebook Visual Image
Grades:
PreK - 12th, Higher Education, Adult Education, Staff
Also included in: Digital Resources Templates Mega Bundle for Personal and Commercial Use
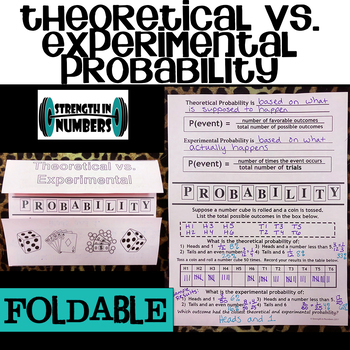
Theoretical vs. Experimental Probability Foldable Notes for Interactive Notebook
Students love foldables for notes! This one covers experimental and theoretical probability. It gives the definition of each and then students will figure out the number of outcomes possible when tossing a coin and rolling a die. They will figure out various theoretical probabilities for that. Then they will actually roll a die and toss a coin 50 times, record their results, figure out the same scenarios using experimental probability, and then compare the two. You will need dice and coins
Subjects:
Grades:
6th - 10th
Also included in: Complete BUNDLE of 50 Foldable Notes for Math 7
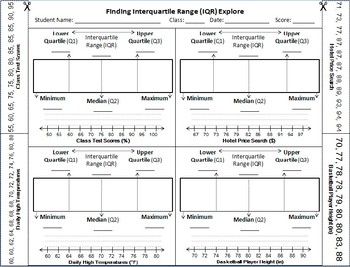
Finding and Comparing Interquartile Range (IQR)
This activity is designed for Texas TEKS listed below. Students use strips of data to fold into 'quartiles' and calculate the IQR.
represent numeric data graphically, including dot plots, stem-and-leaf plots, histograms, and box plots.[6.12A]
interpret numeric data summarized in dot plots, stem-and-leaf plots, histograms, and box plots.[6.13A]
compare two groups of numeric data using comparative dot plots or box plots by comparing their shapes, centers, and spreads.[7.12A]
Subjects:
Grades:
6th - 8th
Showing 1-24 of 499 results

