62 results
11th grade graphing lectures for Microsoft PowerPoint
Algebra 1 Lesson BUNDLE - Systems of Equations
This unit bundle contains lessons over:Graphing Systems of EquationsSolving Systems Using SubstitutionElimination Using Addition & SubtractionElimination Using MultiplicationSystems of InequalitiesEach lesson is done with a bohemian style color pallet; all material is editable, if you need to adjust to your teaching style or your classroom curriculum.
Grades:
9th - 12th
CCSS:
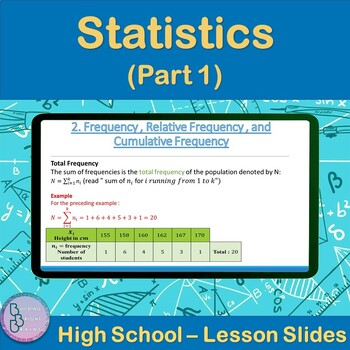
Statistics Part 1 | High School Math PowerPoint Lesson Slides
Are you teaching your High School students about Statistics? Plenty of examples and application exercises are included. You can also easily convert this to a Google Slides lesson by dragging it into your Google Drive.What is included?✦ 30 total slides for notes, examples and applications.✦ All steps are animated to allow the teacher to explain them gradually. Throughout the Lesson, students will be introduced to the following:✦ Statistics Vocabulary✦ Frequency , Relative Frequency , and Cumulati
Subjects:
Grades:
10th - 12th, Higher Education
Histograms and Frequency Tables (Powerpoint) for Busy Teachers
This powerpoint presentation introduces the concept of histograms and frequency tables.
Clipart, sounds, and animation are used sparingly and effectively to help illustrate points without being distracting. This powerpoint presentation has been extensively refined using faculty AND student input and feedback.
Definitions of histogram, interval, frequency table, and frequency are all presented. The progression from a frequency table to a completed histogram is illustrated and animated using
Subjects:
Grades:
4th - 12th, Higher Education, Adult Education
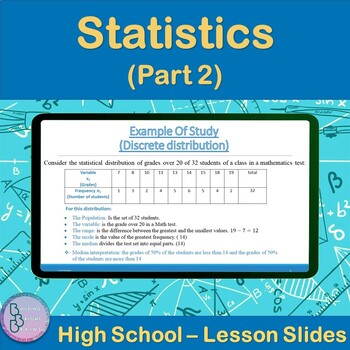
Statistics Part 2 | High School Math PowerPoint Lesson Slides
Are you teaching your High School students about Statistics (Part 2)? Plenty of examples and application exercises are included. You can also easily convert this to a Google Slides lesson by dragging it into your Google Drive.What is included?✦ 18 total slides for notes, examples and applications.✦ All steps are animated to allow the teacher to explain them gradually. Throughout the Lesson, students will be introduced to the following:✦ Statistical Vocabulary✦ Discrete distribution✦ Continuous d
Subjects:
Grades:
10th - 12th, Higher Education
Algebra 1 Lesson - Transformations of Quadratic Functions
This complete lesson can be used with any curriculum and each student will be able toApply translations to quadratic functions.Apply dilations to quadratic functions.Use transformations to identify quadratic functions from graphs and write equations of quadratic functions.This lesson contains vocabulary, processes and progressively more difficult examples for you to guide your students through to aid in their understanding.All material is editable, if you need to adjust to your teaching style or
Grades:
9th - 12th
CCSS:
Also included in: Algebra 1 Lesson BUNDLE - Quadratic Functions
Algebra 1 Lesson - Solving Quadratics by Graphing
This complete lesson can be used with any curriculum and each student will be able toSolve quadratic equations by graphing.This lesson contains vocabulary, processes and progressively more difficult examples for you to guide your students through to aid in their understanding.All material is editable, if you need to adjust to your teaching style or your classroom curriculum.
Grades:
9th - 12th
CCSS:
Also included in: Algebra 1 Lesson BUNDLE - Quadratic Functions
Algebra 1 Lesson - Graphing Quadratic Functions
This complete lesson can be used with any curriculum and each student will be able toAnalyze graphs of quadratic functions.Graph quadratic functions by using key features and tables.Use graphing calculators to analyze key features of quadratic functions.This lesson contains vocabulary, processes and progressively more difficult examples for you to guide your students through to aid in their understanding.All material is editable, if you need to adjust to your teaching style or your classroom cur
Grades:
9th - 12th
CCSS:
Also included in: Algebra 1 Lesson BUNDLE - Quadratic Functions
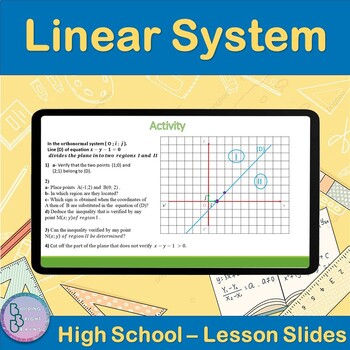
Linear System | High School Math PowerPoint Lesson Slides
Are you teaching your High School students about Linear System? Plenty of examples and application exercises are included. You can also easily convert this to a Google Slides lesson by dragging it into your Google Drive.What is included?✦ 17 total slides for notes, examples and applications.✦ All steps are animated to allow the teacher to explain them gradually. Throughout the Lesson, students will be introduced to the following:✦ Algebraic method of solving✦ Substitution Method ✦ Comparison Met
Grades:
10th - 12th, Higher Education
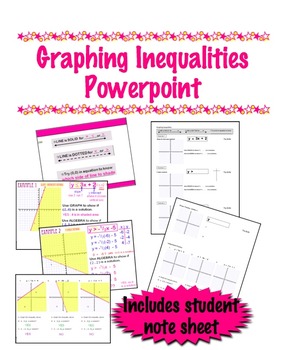
Graphing Inequalities Powerpoint with Student Notes Sheet
This is a powerpoint file with an editable double-sided page student notes. ( WORD file)
The zip file includes:
A 64 slide powerpoint that leads the lesson
A double-sided student notes sheet to work along with the presentation
A page of "group" problems
I originally made this on my interactive board, then took screen shots to make this powerpoint for a colleague. That's why there are so many slides (66!). Instead of annimation, each new slide adds a step of the problem.
The Powerpoint les
Grades:
8th - 11th
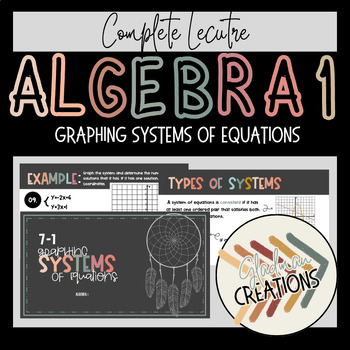
Algebra 1 Lesson - Graphing Systems of Equations
This complete lesson can be used with any curriculum and each student will be able toDetermine the number of solutions of a system of linear equations.Solve systems of equations by graphing.Solve linear equations by graphing systems of equations.This lesson is done with a bohemian style color pallet; all material is editable, if you need to adjust to your teaching style or your classroom curriculum.
Grades:
9th - 12th
CCSS:
Also included in: Algebra 1 Lesson BUNDLE - Systems of Equations
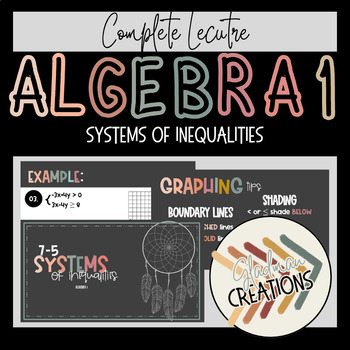
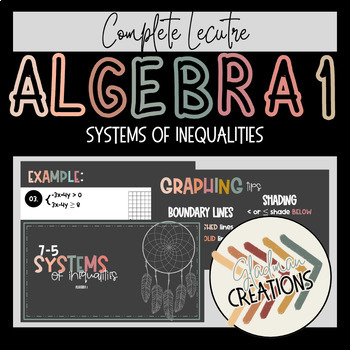
Algebra 1 Lesson - Systems of Inequalities
This complete lesson can be used with any curriculum and each student will be able toSolve systems of linear inequalities by graphing.This lesson is done with a bohemian style color pallet; all material is editable, if you need to adjust to your teaching style or your classroom curriculum.
Grades:
9th - 12th
CCSS:
Also included in: Algebra 1 Lesson BUNDLE - Systems of Equations
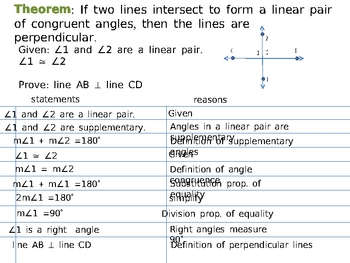
Parallel and Perpendicular Lines: Proofs and Problems
PowerPoint presentations covering seven sessions on parallel and perpendicular lines problems. I use them to present a topic to my class and give them a few examples and/or sample problems. Topics include 1. Parallel and perpendicular postulate 2. Perpendicular lines 3. Parallel lines and transversals 4. Proving lines parallel 5. Proofs involving parallel lines 6. Parallel lines in a coordinate plan 7. Perpendicular lines in a coordinate plane. The slides are full of powerpoint animation and ca
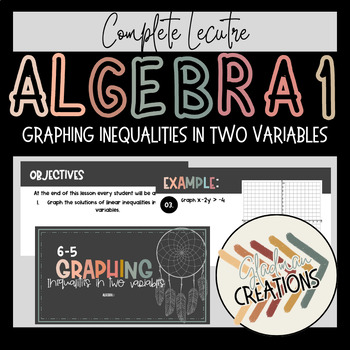
Algebra 1 Lesson - Graphing Inequalities in Two Variables
This complete lesson can be used with any curriculum and each student will be able toGraph the solutions of linear inequalities in two variables.This lesson is done with a bohemian style color pallet; all material is editable, if you need to adjust to your teaching style or your classroom curriculum.
Grades:
9th - 12th
CCSS:
Also included in: Algebra 1 Lesson BUNDLE - Linear Inequalities
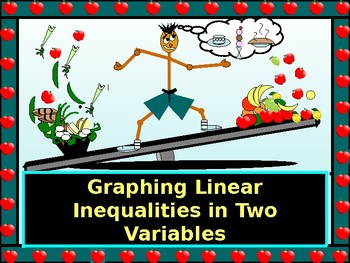
Algebra Power Point: Graphing Inequalities in Two Variables with GUIDED NOTES
With the greatest of enthusiasm, I share my most recent power point with you on "Graphing Inequalities in Two Variables".
* The lesson begins with a review showing ordered pairs as solutions to inequalities.
* Step by step, students move into graphing inequalities of vertical and horizontal lines.
* They review the meaning of boundaries, half-planes, and how to test for the solution half-plane.
* Progressing, they graph inequalities in two variables using slope-intercept
Subjects:
Grades:
7th - 12th, Higher Education, Adult Education
CCSS:
Graphing & Statistics for Biology Google Slides Lesson
Features a Google Slides lesson/presentation that reviews how to make scientific data tables, graph scientific data, and calculate mean, median, mode, and range.The topics covered in this presentation include:Identifying types of DataConstructing Data TablesCalculating Mean, Median, Mode, Range & Standard DeviationPlotting a GraphInterpolation & Extrapolation of DataKeep your students engaged and accountable with this interactive, versatile presentation. Embedded within these 27 colorful
Subjects:
Grades:
6th - 12th
BUNDLE: Algebra PP Solving and Graphing Linear Inequalities/DISTANCE LEARNING
I am delighted to present my BUNDLE of power points covering all required material on "Solving and Graphing Linear Inequalities." * The complete bundle is 290 pages and the $31.50value has been reduced to $26.75, a savings of nearly 16%! * The lessons include the following topics: Solving Inequalities Using Addition and Subtraction, Solving Inequalities Using Multiplication or Division, Solving Multi-Step Inequalities, Solving Compound Inequalities Involving "AND", Solving Compound
Subjects:
Grades:
7th - 11th, Higher Education, Adult Education

Introduction to Data Visualization
This presentation introduces key concepts and considerations in data visualization, including:the history of data visualizationan introduction to the benefits and importance of data visualization types of visualizationshow to choose a visualization typedata visualization design principles and best practicesleading data visualization platforms the differences between raster and vector graphicskey considerations when thinking about creating a visualization Use this as part of a unit on graphing, d
Subjects:
Grades:
6th - 12th, Higher Education, Adult Education, Staff
Also included in: Graphic Design Growing Bundle
Logarithms & Their Graphs
This PowerPoint lesson shows students the properties of logarithms -- converting between logarithmic form and exponential form, evaluating logarithmic equations, and graphing logarithmic functions. This was designed for a Pre-Calculus class, so it has a lot of information in the one lesson since it would be a review for them. It could be used as an Algebra 2 lesson, but may need to be divided up into two or three lessons.
Subjects:
Grades:
10th - 12th, Higher Education
Algebra 1 Lesson - Representing Relations
This complete lesson can be used with any curriculum and each student will be able to:represent relationsinterpret graphs of relationschoose and interpret appropriate scales for the axes and origin of graphsThis lesson is done with a bohemian style color pallet; all material is editable, if you need to adjust to your teaching style or your classroom curriculum. Answer key included!!
Grades:
9th - 12th
CCSS:
Also included in: Algebra 1 Lesson BUNDLE - Complete Course
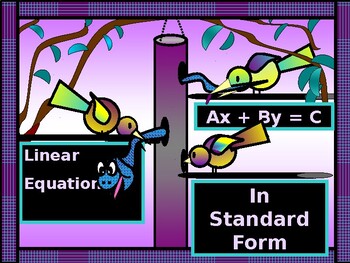
Algebra Power-Point: Writing Linear Equations in Standard Form DISTANCE LEARNING
The lesson today truly puts the student to the test. * All forms of a Linear Equation are now part of the garnered information students have worked diligently to acquire. * They begin a journey in manipulating the three forms from one to the other with fluency! * Besides becoming masters at converting from one form to the other, they are realizing the correct form to use where leading coefficients and integer coefficients are concerned when they are using Standard Form. * Students write l
Grades:
7th - 11th
CCSS:
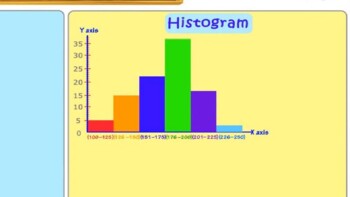
Histogram Powerpoint
The presentation contains:Learning Objectives.Definition of a Histogram.Parts of a histogram.Difference Between bar graph and histogram.Types of intervals.Tips for construction of bar graph.Steps to construct bar graph with an example.Read and Interpret a histogram.
Subjects:
Grades:
7th - 11th, Staff
Also included in: Data Representation Powerpoint
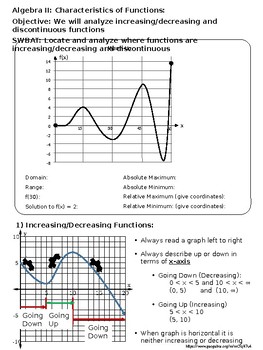
Algebra 2: Characteristics of Functions Student Notes Pt 2
Objective: Students will analyze increasing and decreasing intervals, maximums, minimums, domain, range, y-intercept, continuous, and discontinuous functions
Subjects:
Grades:
8th - 12th
Exponential Functions & Their Graphs
This PowerPoint lesson was written for a Pre-Calculus class to review the graphs of exponential functions. It show examples of exponential growth and decay, and the graphs of each. It also has examples of compound interest and compounding continuously interest. It could be used as a unit review for Algebra 2, but would need to be broken into several units if used as new material.
NOTE: Math Type 5.0 was used to create this lesson.
Subjects:
Grades:
10th - 12th, Higher Education
Introduction to Data Visualization - Google Slides Presentation
This fully editable Google Slides presentation introduces key concepts and considerations in data visualization, including:the history of data visualizationan introduction to the benefits and importance of data visualizationtypes of visualizationshow to choose a visualization typedata visualization design principles and best practicesleading data visualization platformsthe differences between raster and vector graphicskey considerations when thinking about creating a visualizationUse this as par
Subjects:
Grades:
6th - 12th, Higher Education, Adult Education
Also included in: Graphic Design Growing Bundle
Showing 1-24 of 62 results


