33 results
Elementary statistics homeschool curricula under $5
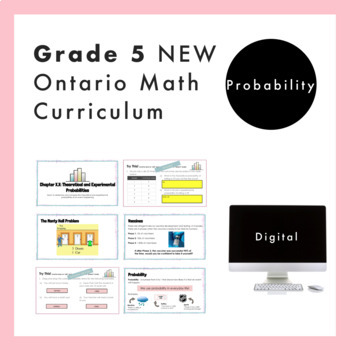
Grade 5 Ontario Math - Probability Curriculum - Digital Google Slides+Form
Are you planning for the NEW Grade 5 Ontario Math Curriculum? This fully editable, NO PREP Google Slide resource is what you need! This resource is for the DATA strand and covers all specific expectations for “D2. Probability”. In this resource, students will experience math through engaging real-life questions, storytelling through math, and interactive slides. For teachers who are given Nelson© Math by your board, this resource loosely follows the order of the Probability chapter (Chapter 13)
Subjects:
Grades:
4th - 6th
Also included in: Grade 5 NEW Ontario Math Curriculum Full Year Digital Slides Bundle
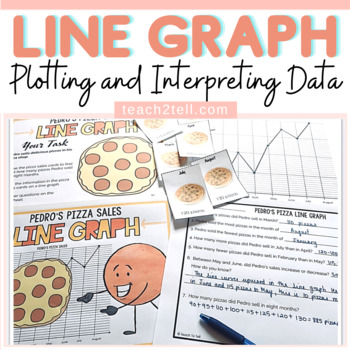
Line Graph Activity | Plotting and Interpreting Data on a Line Graph
Looking for a line graph activity that involves plotting and interpreting data on a line graph? Your students will enjoy this hands-on center activity that involves recording pizza sales over a given period using card visuals. They will get to plot and interpret data on a line graph.Items IncludedFile folder cover (2 options): if placing all items in a file at a centerSingle large task card (color and blackline) on a sheet outlining the taskTwo small task cards (color and blackline) on a sheet o
Subjects:
Grades:
2nd - 5th
Food Justice, Food Sovereignty and the Zero Mile Meal; Food & Math
This is one in a continuing series of activities that takes mathematics and applies it to social issue, including Food Waste and Mathematics: From Farm to Table to Dump, Mathematics, Demographics & Slavery: The 1790 Census in Ratio, Percents & Graphs, MathBusters: Percentage Practice to Analyze 2016 Election Results, and Statistics, Histograms and Lies Presidential Candidates Tell. In this case, we are looking at how far food must travel in order to make it from where it is produced to t
Subjects:
Grades:
5th - 12th
Money and Entertainment: Multi-Step Scenario Task Cards (Decimals,Percentages)
This product is about money, decimals, discounts, taxes, percentages, multiple-step problems, and financial literacy!! I truly hope you and your students will enjoy and benefit from it! Perfect tasks for stations/centers or enrichment!The packet includes four task cards and four information cards on different types of entertainment: NFT Game Time A Night at the Movies An Evening at the Symphony Dinner Out at Billy Bob Joe’s Pizza ShopThese tasks focus on expenses incurred for a fun time of ente
Subjects:
Grades:
5th - 8th
Describe the Distribution of a Data Set
This Common Core statistics and probability lesson teaches students how to describe the distribution of a data set. The lesson includes research-based strategies and strategic questions that prepare students for Common Core assessments. In this lesson, students will describe the distribution of data sets. This lesson focuses on describing a variety of statistical distributions in different situations. Students are asked to describe different related data sets and describe what that means. In
Subjects:
Grades:
5th - 7th

Choose Your Measure? (Central Tendencies and Range)
Copy the teacher cards and cut into four sections. Review mean, median, mode and range with the students. Students will need their pencil and a piece of scratch paper.
Either make a transparency, pull up on a Smart Board or put one of the cards under a document camera.
Students will determine which measure they would want the teacher to use in determining their final average.
Tell the students to hold up the card that matches their answer.
Subjects:
Grades:
5th - 8th
Olympic Sprint Records: Using Decimals to Understand and Predict Records
Since the first modern Olympics in 1896, runners in the 100 meter sprint have been setting records on a regular basis, earning the title of the "fastest human on earth." How long can these records be broken? Will there eventually be a runner who can do the 100 meter sprint in just a few seconds? This activity shows students how the change from measuring time from tenths of a second to hundredths of a second allowed more records to be broken, and that by graphing these records, the new records ca
Subjects:
Grades:
5th - 9th
What is the Value of a Hit? The Mathematics of Baseball using Ratios & Percents
Are you interested in developing your students' understanding of decimals and statistics using baseball? This activity focuses on the skills of computing and comparing batting averages, as well as seeing what effect a "hit" can have on a player's average; that is, a player with fewer "at bats" will get a bigger "bump" from a hit, than a player with many at bats. This activity encourages students to see that a single statistic cannot tell you everything about the quality of a baseball player.
Subjects:
Grades:
5th - 8th
Statistics and Probability: 6.SP.A.1-3
This product addresses concepts related to the development of understanding of statistical variability. It focuses on statistical questions and describing distributions.Visit Suzanne's Classroom Store! The resources are designed to enrich or supplement your current curriculum.Included are 6 practice sheets (8 pages) that can be used for practice, homework, at a math station, or even for an assessment. All answer keys are included.Additionally, there is 6-page foldable "booklet" that gives "Hel
Subjects:
Grades:
5th - 7th
Also included in: Statistics and Probability: CCSS 6.SP.1-5 Bundle
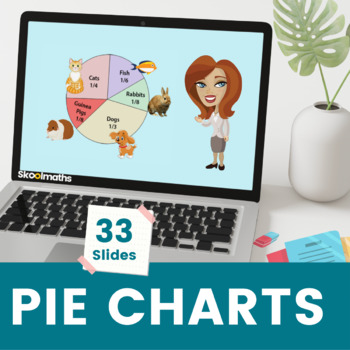
Interpreting Pie Chart No-Prep Interactive Digital Math 5th Grade
Interpreting Pie Chart No-Prep Interactive Digital Math 5th GradePi Day Activities Pie Chart is a completely interactive digital resource for fifth grade to 7th-grade class. In this lesson, learners will learn how to interpret and construct pie charts and use these to solve problems.The lesson can be used for whole class teaching by teachers and at home by learners.There are lots of differentiated drag and drop activities with instant feedback.Here's What's included:This digital math resource co
Subjects:
Grades:
5th - 7th
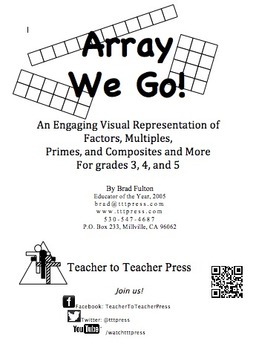
Array We Go! Introducing Multiplication, Factors, Primes, & Composites
This is an engaging and visual way to introduce multiplication and the concepts of factors, multiples, primes, composites and MORE! Students build arrays for the numbers 1–25 and look for patterns and characteristics that help them learn to recognize multiples. Directed questions also help them to learn to identify primes and composites. Square numbers, factor rich numbers, and perfect numbers are included for more advanced students.
Extensions allow you to take the lesson to a multi-day in dept
Subjects:
Grades:
3rd - 6th

Distance Learning - Project Based Learning - Water Bottle Flip 2.0 Google Slides
This product is designed for homeschooling or distance learning using Google slides/Google Classroom. Students will be creating the MOST AWESOME Water Bottle Flip in the style of Dude Perfect! It is completely STEAM integrated with "I can" statements for each area. Students will collect data and follow the Engineering Design Process throughout the challenge. Dude Perfect is a super popular YouTube channel. The Dude Perfect team uses the Engineering Design Process in every creation they create! I
Subjects:
Grades:
4th - 7th
Types:
NGSS:
MS-ETS1-2
, 3-5-ETS1-3
, MS-PS2-4
, MS-ETS1-4
, 4-PS3-3
...
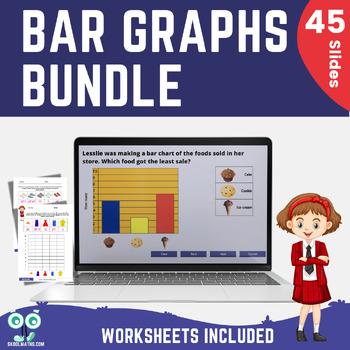
2nd Grade Graphing Unit No-Prep Digital Activities with Printable Worksheet
No-Prep Graphing Unit Digital Activities for 2nd Grade with Printable WorksheetWant engaging Graphing Unit activities that will teach your learners how to interpret and present data using bar charts? Buy this great value bundle of interactive lessons today to save you hours of planning and don't forget to leave an honest review if you download this digital resource bundle for TPT credit :)These amazing interactive activities will give your 2nd grade and grade 3 class ample opportunities to pract
Subjects:
Grades:
2nd - 3rd
Also included in: Handling Data - 2nd - 3rd Grade Bundle
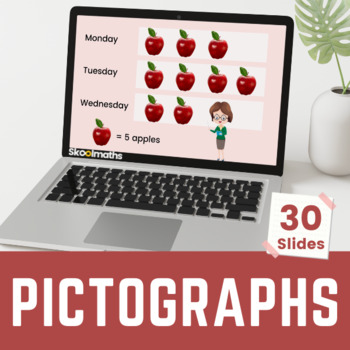
No-prep Interactive Pictograph Digital Activities for 2nd Graders
No-prep Interactive Pictograph Digital Activities for 2nd GradersTake your students' data analysis skills to the next level with our interactive pictograph activities for 2nd graders. These engaging, hands-on resources will help students understand how to represent data visually using pictographs.Learning Objectives:Organize and represent data using pictographs.Analyze and interpret data from pictographs.Understand the relationship between data and its representation in pictographs.Apply knowled
Subjects:
Grades:
1st - 2nd

Distance Learning - Project Based Learning - Ping Pong Trick Shot Google Slides
This product is designed for at home distance learning. Students will create the MOST AWESOME Ping Pong Trick Shot in the style of Dude Perfect! It is completely STEAM integrated with "I can" statements for each area. Students will collect data and follow the Engineering Design Process throughout the challenge. Dude Perfect isa super popular Youtube channel. The Dude Perfect team uses the Engineering Design Process in every creation they create!Students will enjoy using this in Google Slide form
Subjects:
Grades:
4th - 7th
Types:
NGSS:
MS-ETS1-2
, 3-5-ETS1-3
, MS-PS2-4
, MS-ETS1-4
, 4-PS3-3
...
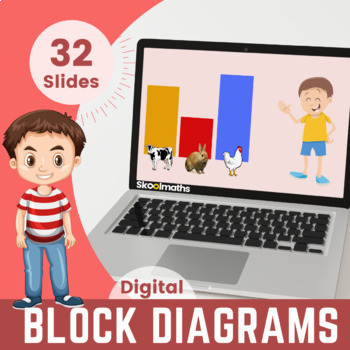
Block Diagrams Interactive Digital Activities for 1st Grade
Block Diagrams | 1st Grade | Interactive Activities #dollardealsBlock diagrams is a completely interactive lesson designed for learners in 1st grade. Buy this great value bundle of interactive lessons today to save you hours of planning and don't forget to leave an honest review if you download this worksheet for TPT credit :)Learning Objectives:Interpret and construct simple block diagrams.Answer simple questions by counting the number of objects in each category.Sort the categories by quantity
Subjects:
Grades:
1st - 2nd
CCSS:
Also included in: First Grade Math Bundle Interactive Lessons, Activities and Worksheets
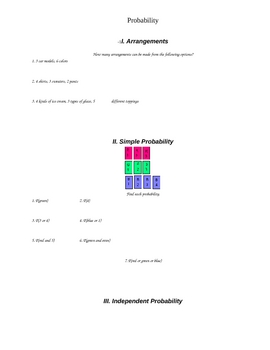
Probability
A great 2 page, five part general overview of probability. Would be good for either introduction or review. I used this a part of my math team's notes as well in in the classroom.
Subjects:
Grades:
4th - 12th

Who Am I? (Central Tendencies and Range)
Copy the teacher cards and cut into four sections. Review mean, median, mode and range with the students. Students will need their pencil and a piece of scratch paper.
Either make a transparency, pull up on a Smart Board or put one of the cards under a document camera.
Tell the students to hold up the card that matches their answer. They may end up holding more than one card and that is perfectly fine. We are asking them to describe the number...not the data set.
Subjects:
Grades:
5th - 8th

Probability for Fifth Graders
If your child is struggling with math, then this book is for you; the short book covers the topic and also contains 30 practice problems to work with.
This subject comes from the book “Fifth Grade Math (For Homeschool or Extra Practice)”; it more thoroughly covers more fifth grade topics to help your child get a better understanding of fifth grade math. If you purchased that book, or plan to purchase that book, do not purchase this, as the problems are the same.
Subjects:
Grades:
5th
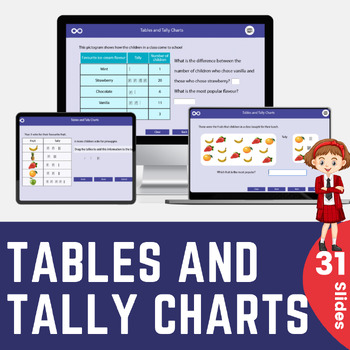
Graphing Unit: Tables and Tally Charts Digital Activities and Worksheets No Prep
Want an engaging Graphing Unit activity that will teach your learners how to interpret and present data using tables and tally charts? Buy this great value bundle of interactive lessons today to save you hours of planning and don't forget to leave an honest review if you download this worksheet for TPT credit :)These amazing interactive activities will give your 2nd grade and 3rd-grade class ample opportunities to practice their skills in solving one-step and two-step questions using information
Subjects:
Grades:
2nd
Also included in: Handling Data - 2nd - 3rd Grade Bundle
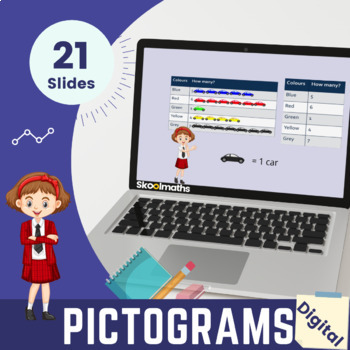
Picture Graphs | Represent and Interpret Data | 2nd Grade Activities
Want an engaging Graphing Unit activity that will teach your learners how to draw a picture graph? Buy this great value bundle of interactive lessons today to save you hours of planning and don't forget to leave an honest review if you download this worksheet for TPT credit :) In this lesson, learners will be able to:Draw a picture graph with a single-unit scale to represent a data set with up to four categories. Interpret and present data using pictograms and tables.Solve one-step and two-step
Subjects:
Grades:
1st - 3rd
Types:
Also included in: Handling Data - 2nd - 3rd Grade Bundle
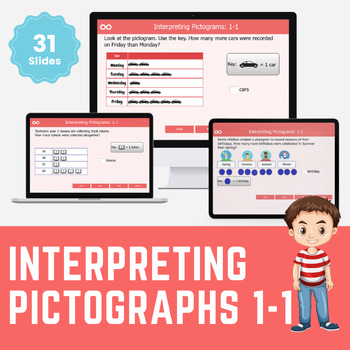
Interpreting Pictographs (1 to 1) Interactive Activities for Second Grade
Interpreting Pictographs Second Grade Interactive ActivitiesThese amazing interactive 2nd grade math activities open the doors to ample practice, whether you intend to extend your learners' understanding of data, build fluency in interpreting pictographs, gain a solid foundation in constructing picture graphs, answer sum and difference questions using pictograms, work with tables and charts, describe and analyze data, or draw and interpret picture and bar graphs, there's something to interest ki
Subjects:
Grades:
2nd
Also included in: Data and Graphing Activities and Worksheets for First Grade
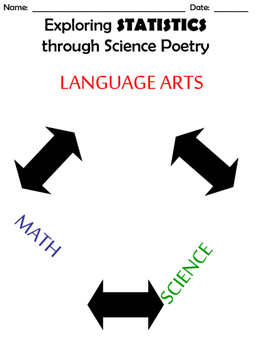
Exploring STATISTICS through poetry!
I am always looking for ways to incorporate more than one subject and this lesson covers them all! Science, math, and language arts all in one fun, engaging lesson.
1. Start off by reading and talking about the poem. I usually try to do this when there has been a current event that involves an earthquake somewhere in the world or during our earthquakes and volcanoes unit.
2. Divide class into four groups (the fourth group is the easiest so this is the perfect time for differentiation!).
Subjects:
Grades:
5th - 9th
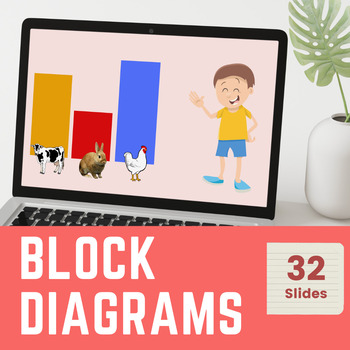
First Grade Bar Graph Fun: Interactive Digital Activities and Worksheets
First Grade Bar Graph Fun: Interactive Digital Activities and WorksheetsTake your first grader's data analysis skills to the next level with our engaging bar graphs digital activities. This no-prep math resource pack includes a collection of interactive activities and printable worksheets designed to introduce young learners to the concept of bar graphs. Your child will learn to read, interpret, and create bar graphs while having fun. Perfect for use in the classroom or at home, these activities
Subjects:
Grades:
1st - 3rd
Showing 1-24 of 33 results


