1,814 results
Elementary statistics activities under $5
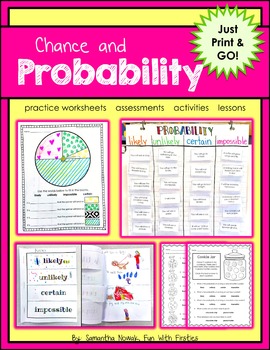
Probability: Print & Go! worksheets, activities, lessons, and assessments
*UPDATED! The file has been updated to include options for different terminology (i.e. the original "likely, unlikely, certain & impossible" terms are still included but options to use "impossible, possible, & certain" are now included as well).These probability printables are sure to help your kiddies get a better grasp on the sometimes difficult concept of probability and likelihood. Key math words (likely, unlikely, certain, and impossible) are used consistently throughout this pack t
Subjects:
Grades:
K - 2nd
Types:
6th Grade Statistics Project: Analyzing Zombie Virus with Dot Plots and Mean
I created this project as a way for my 6th graders to practice their statistical skills. They loved it! They get to pretend to be epidemiologists studying a virus outbreak that is turning people into zombies. It's a fantastic way for students to see how statistics is used in the "real world" - they were also very interested to learn about the field of epidemiology. The Project: Students are given data about infected people who are quarantined in an airport. They are also given two maps of the US
Subjects:
Grades:
5th - 7th
Types:
Mean Median and Mode Math Mystery Game Activity - 6th Grade Math Edition
Mean, Median, and Mode Review Activity - 6th Grade Edition: The Case of Mean Mountain. Engage and motivate your students with this fun math mystery activity! Great for practice and review! Now available with printable and digital worksheets! Easy prep! Just Print the worksheets & Solve! Or go paperless with the new Google Slides option provided within your download.--------------------------------------------------------------------------------------------⭐Optional video hook included for i
Subjects:
Grades:
5th - 8th
Types:
Also included in: 6th Grade COMPLETE Math Mystery Bundle CSI Math Review Activities
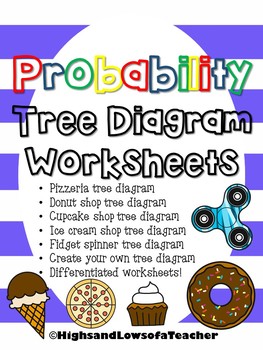
Probability Tree Diagram Worksheets
Use these tree diagram worksheets to help students learn all the outcomes (combinations) for probability unit.What's included-*Pizza toppings probability tree diagram*Donut probability tree diagram*Cupcake probability tree diagram*Ice cream probability tree diagram*Fidget spinner probability tree diagram*Create your own tree diagramAll worksheets come differentiated---one page that has tree diagram drawn in with some combinations already filled-one with tree diagrams drawn in-one blank page only
Subjects:
Grades:
3rd - 8th
Types:
Also included in: Probability Activity BUNDLE
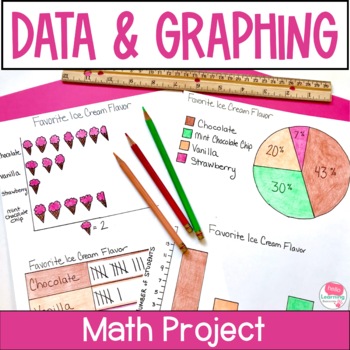
Data and Graphing Project - Real World Math Project Based Learning Activities
This data and graphing project gives your students a meaningful way to apply their data and graphing skills. Use this real world math project as an end of unit activity, enrichment activity or assessment. Easy to use and fun for students!Click the PREVIEW button above to see everything that is included in this fun math project!⭐ This resource includes:teacher information, directions and sample schedulesupply listgrading rubricstudent direction sheettwo data collection sheets (one for open ended
Subjects:
Grades:
4th - 6th
Types:
CCSS:
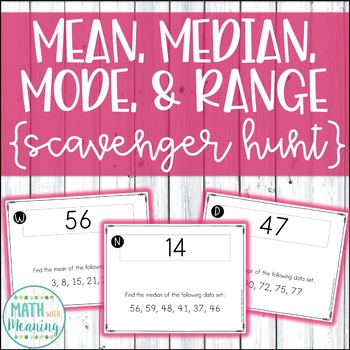
Mean, Median, Mode, and Range Scavenger Hunt Activity - CCSS 6.SP.B.5.C
Make practicing finding mean, median, mode, and range fun! This self-checking activity will allow students to get out of their seats and move around the classroom as they solve 16 problems. Each problem solved will lead the students to a new problem to solve until they have solved all 16 problems. You will be amazed at the math talk you hear and the collaboration between students as they work on this activity!Each data set includes 4-8 numbers. The answer to each problem is a whole number. There
Subjects:
Grades:
5th - 8th
Types:
CCSS:
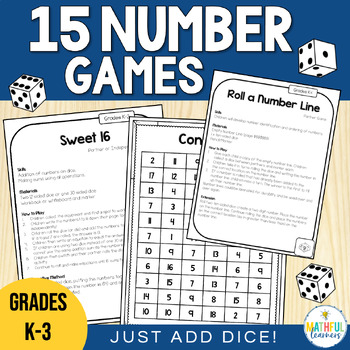
Dice Math Games - 15 Printable Number Centres - K to 3
Playing these Dice Number Games will keep your students engaged and eager to learn more during your next math centers. Including 15 number games, these printable dice games can easily be used as your warm up activity or as a complete math lesson. Your students will practice basic math skills all while having FUN. Most games can be played over and over again in your Grade K-3 classroom! All resources are provided, simply read and copy off game boards as required, and JUST ADD DICE! In search of
Subjects:
Grades:
K - 3rd
Types:
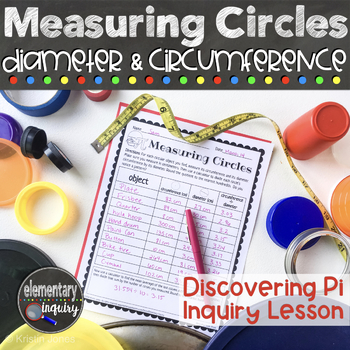
Measuring Circle Circumference & Diameter to Discover Pi - Pi Day Inquiry Lesson
Have fun finding Pi by measuring the circumference and diameter of circles of all sizes! Students will calculate the ratio of the length of a circle’s diameter to its circumference. They’ll discover that the circumference is always a little more than three times as long as the diameter. This full lesson plan and teacher script will help you lead an inquiry based investigation and class discussion. It’s perfect for an introduction to these geometry concepts, or for a fun Pi Day activity.A full, f
Subjects:
Grades:
5th - 7th
Types:
CCSS:
Also included in: Pi Day Activities - Measuring Circles Diameter, Circumference, and Area
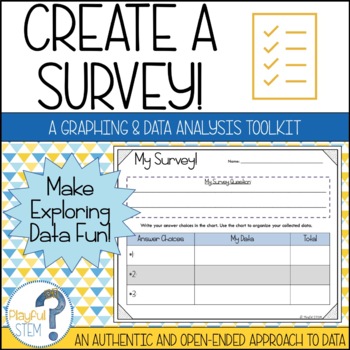
Create Your Own Survey: Collect, Organize, Graph, and Analyze Data
One of my best-selling TPT products -- now updated with a fresh look and new content!Teach Data Analysis the open-ended and engaging way -- through student-directed surveys!This resource pack is designed to help students follow the process of creating a survey: they will brainstorm questions, collect data, organize their obtained data, create multiple graphs to show their data, and then reflect on and analyze what their data tells them.The survey pack includes the following:Brainstorming Survey
Subjects:
Grades:
2nd - 5th
Types:
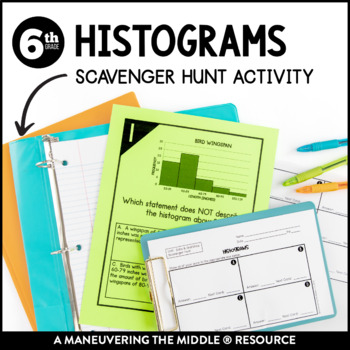
Histograms Scavenger Hunt | Interpreting Histograms Activity
This Histograms Scavenger Hunt consists of 10 clue cards where students must use the clue to interpret histograms. This activity focuses on analyzing histograms and determining which statements are represented in the histogram. This activity is great for in class practice! Students can get out of their seats and move around, while still applying their understanding of data and statistics. Students are able to practice and apply concepts with this histograms activity, while collaborating and havi
Subjects:
Grades:
5th - 7th
Types:
Theoretical and Experimental Probability M&M activity
Students need to find the probability of picking certain colored M&Ms, and asked to change them into decimals, fractions, and percents. They are asked to draw specific M&Ms at random for experimental probability problems. They are asked to make a few predictions, as well. This is a lengthy lesson and takes a while to get through, so make sure you have enough time to get through it. It can be done in 2 days, and if you need to use colored chips or counters instead, go for it!
Subjects:
Grades:
5th - 11th
Types:

Stem and Leaf Plots Whodunnit Activity - Printable & Digital Game Options
Nothing like a good criminal investigation to liven up stem and leaf plots! Based off my popular CSI projects, I have created Whodunnits? The Whodunnits plan to focus on single content topics as opposed to units and will focus more on skill building than application. Every day can't be a project day, so Whodunnits can be an engaging out of their seat activity to practice important skills. In a Whodunnit?, students will work in teams to solve 10 practice problems that increase in difficult. After
Subjects:
Grades:
5th - 10th
Types:
CCSS:
Also included in: Pre-Algebra Whodunnit Activity Bundle - Printable & Digital Game Options

Google Sheets Digital Pixel Art Math Finding the Mean Median Mode Range
Students will calculate the MEAN, MEDIAN, MODE and RANGE of 5 sets of data to reveal a pixel art design via Google Sheets. This pixel art resource currently contains just one Level. Correct answers will be indicated by the text color changing from red to black with a green highlight and students will be rewarded with colored pixels appearing in the mystery image. Incorrect answers will be indicated by the text color staying red and colored pixels will not be rewarded.The mystery pixel art imag
Subjects:
Grades:
5th - 8th
Types:
Also included in: CUSTOM BUNDLE for LAYNE W.
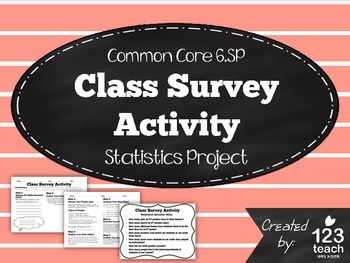
Class Survey Activity - Common Core 6th Grade Statistics Project
This "Class Survey Activity" includes a two page activity aligned to common core standards for statistics and probability (6.SP).
Students will have to come up with a statistical question to survey their classmates. Then, the students will record their results, create a graph, and analyze their data. Lastly, the students will present their results with the class. With my class, I give the students at least a full class period to complete the activity, and then it takes another class perio
Subjects:
Grades:
5th - 7th
Types:
Also included in: Math Assessments and Review Activities BUNDLE for 6th Grade Common Core
Gold Rush Dice Game
This exciting free-for-all game will bring the excitement of the Gold Rush to your classroom! Using a pair of dice, each group will try to gain as many pieces of gold as possible for 2 years. But be careful, robbers and crooks are around every corner. The group with the most gold wins! This file includes a blank chart to keep track of your rolls and gold count, a comprehensive rules sheet, an alternative rules sheet, and a reminder handout for each group. This game will add to your discussio
Subjects:
Grades:
5th - 11th
Types:
Also included in: American History Dice Game Bundle #1
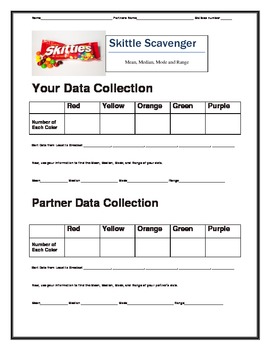
Skittles Candy with Mean, Median, Mode, Range, and Box and Whiskers Plot
This is a quick, fun activity to use with statistics. I have the kids bring in a pack of skittles and sort by color. Then all of the kids will find the Mean, Median, Mode, Range, and Box and Whiskers.
Subjects:
Grades:
4th - 8th
Types:
Also included in: Statistics Unit
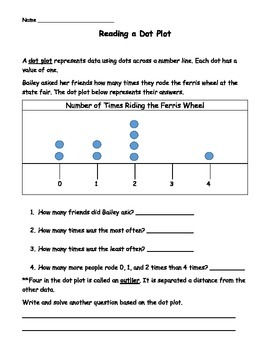
Dot Plot Worksheets
Students will read and create dot plots with these four worksheets. Students get experience interpreting data from dot plots as well as using vocabulary such as an outlier.
Two worksheets are reading a dot plot.
Two worksheets are creating dot plots from frequency tables including using a class survey of hours of sleep for data.
Answer key included for pages.
If you like this product, please rate me! I appreciate your feedback.
More math items can be found at my store, Always Love Learning.
Subjects:
Grades:
3rd - 6th
Types:
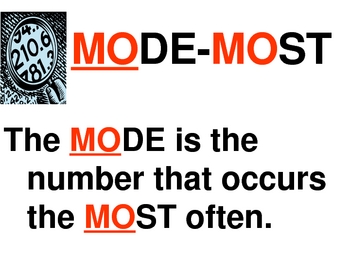
Statistics Mean, Median, Mode & Range Interactive PowerPoint by Erica
Introduce statistics including mean, median, mode and range with this colorful, interactive 22 slide PowerPoint. This interactive PowerPoint introduces each term and teaches a strategy for finding the value. There is also a trick or visual to help students remember the steps to find each one (mean, median, mode and range). Students are able to practice finding the mean, median, mode and range and then check within the PowerPoint. This is excellent for a statistics lesson or for students to e
Subjects:
Grades:
3rd - 6th
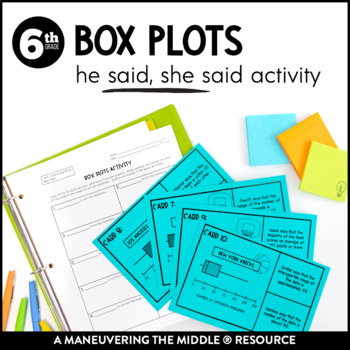
Box Plots Error Analysis | Measures of Center & Variability Box Plot Activity
This Box Plots He Said, She Said Activity consists of 10 cards where students must analyze errors and justify their responses. This activity focuses on box plots and their measure of center and variability. This activity works best in a collaborative setting where students will use mathematical discourse to discuss and defend their responses. An excellent way to incorporate higher level thinking skills! Students are able to practice and apply concepts with this box plots activity, while collabo
Subjects:
Grades:
5th - 7th
Types:
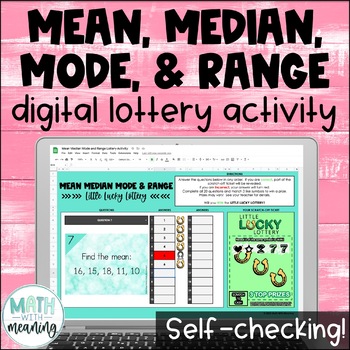
Mean Median Mode and Range Self-Checking Digital Activity - Measures of Center
Looking for a fun self-checking activity to practice finding mean, median, mode, and range? Students will solve 20 problems in this engaging, no-prep digital lottery activity!Each data set includes 4-8 numbers. The answer to each problem is a whole number. There are problems where there is no mode. Please look at the preview file to see if these types of problems are appropriate for your students.In this activity, students will answer questions in order to scratch off their digital lottery ticke
Subjects:
Grades:
5th - 8th
Types:
CCSS:
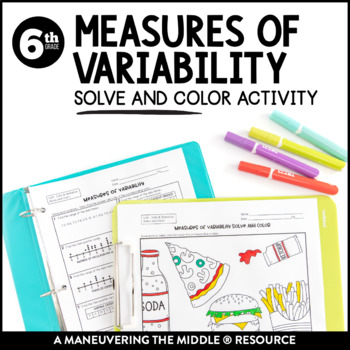
Measures of Variability Coloring Activity | Range & Interquartile Range Activity
This Measures of Variability Solve and Color consists of 8 problems where students will calculate the range or IQR from a data set, dot plot or table. Then, they will locate the answer and color the picture accordingly.This activity is great for in class practice or as a way to spice up independent work! Students can color, while still applying their understanding of measures of variability.Students are able to practice and apply concepts with this measures of variability activity, while collabo
Subjects:
Grades:
5th - 7th
Types:
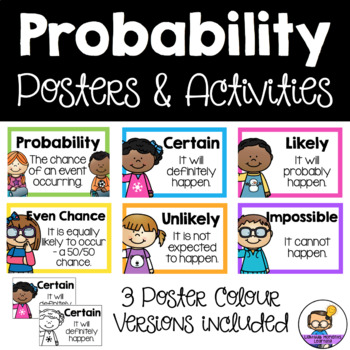
Probability Activities & Posters
It would be IMPOSSIBLE for you not to love these probability posters and activities! I am CERTAIN that these activities will be a fun addition to your classroom and provide a fun way to teach your students about probability.
This resource covers the terms Certain, Likely, Even Chance/Equally Likely, Unlikely and Impossible.
Posters included:
• Probability
• Certain
• Likely
• Even Chance (Equally Likely option included)
• Unlikely
• Impossible
Note: 3 colour versions included
Activities:
Subjects:
Grades:
1st - 4th
Types:
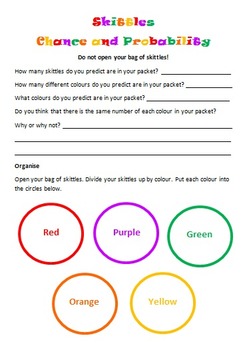
Skittles Chance and Probability (Editable)
Chance and Probability activity using yummy Skittles!!!
Students are to predict the colours and quantities before they open the skittles bag. Students are to complete a chance experiment where they use a tally to collect their data. Students then transfer their data in fractions, decimals and percentages. Students are to create a bar graph using their data as well as answer chance and probability questions about the data. I used this with my grade 5/6 students and they loved it!
Subjects:
Grades:
3rd - 10th
Types:
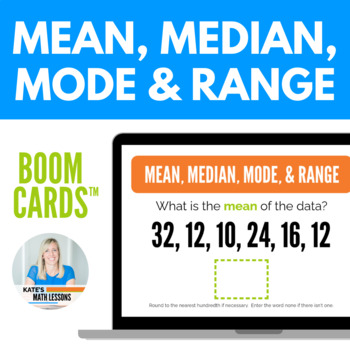
Mean, Median, Mode, & Range Digital Activity Boom Cards™
Working on mean, median, mode, and range? This set of 34 digital task cards is a great way to help students practice finding measures of central tendency: mean, median, mode, and range of a data set (MMMR). Students are shown one question at a time and get instant feedback! The first few cards help students review the meaning of each term before finding the measures of central tendency. Data sets are given as lists of numbers, in tables, or in word problems (you can hide any cards you don't
Subjects:
Grades:
5th - 7th
Types:
Showing 1-24 of 1,814 results


