1 result
Statistics projects for staff $10 and up

Graphing, Statistics & Data Analysis in Middle Grades Using TI-Nspire
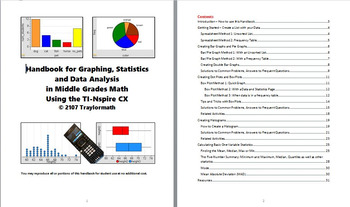
This 30-page handbook ties together everything you need to use TI-Spire technology to teach middle school level data graphing and statistics. It will show you, step-by-step, how to create bar graphs, pie graphs, dot plot, box plots and histograms, and several methods for finding mean and quartiles, as well as an easy way to calculate Mean Absolute Deviation (MAD) with TI-Nspire. It also answers all those student questions about "why doesn't my graph look right?" Developed though several years of
Subjects:
Grades:
5th - 9th, Staff
Showing 1-1 of 1 results


